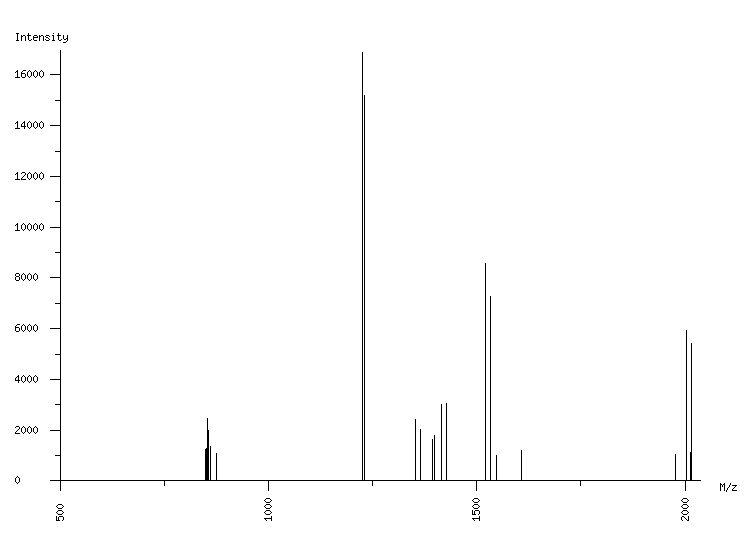
ORGANISM: Homo sapiens
GEL: Human AGS cells; cellular proteins; phosphoproteome
SPOT_ID: 509

|
| M/z |
| 849.51 |
| 850.52 |
| 854.28 |
| 855.42 |
| 861.44 |
| 876.28 |
| 1225.58 |
| 1230.59 |
| 1231.60 |
| 1353.68 |
| 1365.72 |
| 1393.58 |
| 1399.61 |
| 1416.66 |
| 1428.70 |
| 1521.69 |
| 1532.72 |
| 1533.72 |
| 1547.73 |
| 1607.89 |
| 1977.06 |
| 2003.07 |
| 2014.10 |
| 2015.11 |
|
| Intensity |
| 1232 |
| 1282 |
| 2476 |
| 2005 |
| 1351 |
| 1078 |
| 16900 |
| 1171 |
| 15195 |
| 2422 |
| 2029 |
| 1644 |
| 1773 |
| 2996 |
| 3064 |
| 8576 |
| 1325 |
| 7284 |
| 1022 |
| 1218 |
| 1061 |
| 5911 |
| 1137 |
| 5402 |
|
|
(24 total) |
| | matched peaks |
| | contaminants |
|