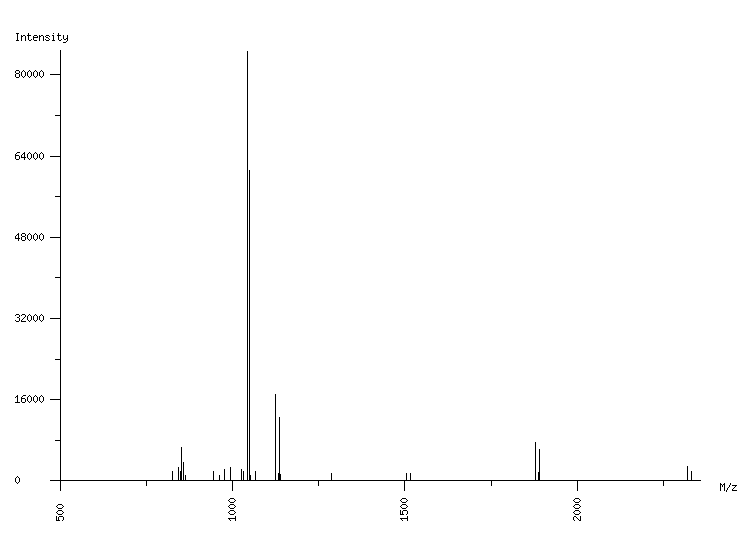
ORGANISM: Homo sapiens
GEL: Human AGS cells; cellular proteins; phosphoproteome
SPOT_ID: 488

|
| M/z |
| 825.10 |
| 845.08 |
| 850.53 |
| 853.44 |
| 859.45 |
| 864.54 |
| 945.47 |
| 963.53 |
| 977.48 |
| 995.54 |
| 1025.53 |
| 1031.55 |
| 1043.54 |
| 1048.55 |
| 1049.56 |
| 1052.69 |
| 1065.51 |
| 1123.58 |
| 1133.66 |
| 1135.62 |
| 1139.58 |
| 1287.72 |
| 1504.63 |
| 1516.68 |
| 1877.94 |
| 1888.98 |
| 1889.98 |
| 2320.10 |
| 2332.14 |
|
| Intensity |
| 1788 |
| 2581 |
| 1907 |
| 6512 |
| 3692 |
| 1132 |
| 1810 |
| 1050 |
| 2203 |
| 2663 |
| 2259 |
| 1778 |
| 84682 |
| 2659 |
| 61221 |
| 1064 |
| 1921 |
| 17070 |
| 1562 |
| 12555 |
| 1295 |
| 1550 |
| 1398 |
| 1511 |
| 7501 |
| 1593 |
| 6297 |
| 2871 |
| 1927 |
|
|
(29 total) |
| | matched peaks |
| | contaminants |
|