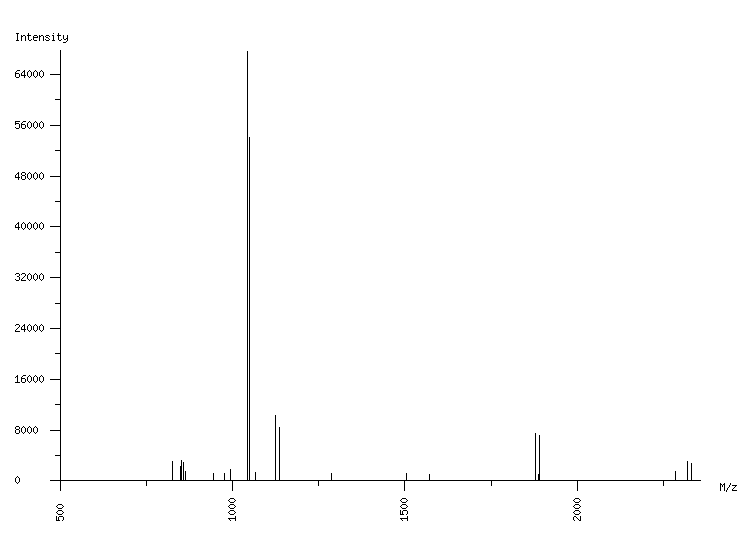
ORGANISM: Homo sapiens
GEL: Human AGS cells; cellular proteins; phosphoproteome
SPOT_ID: 486

|
| M/z |
| 825.10 |
| 848.52 |
| 850.52 |
| 853.43 |
| 859.46 |
| 864.53 |
| 945.46 |
| 977.47 |
| 995.55 |
| 1043.53 |
| 1048.55 |
| 1049.55 |
| 1065.52 |
| 1123.57 |
| 1135.61 |
| 1287.70 |
| 1504.63 |
| 1572.83 |
| 1877.94 |
| 1888.99 |
| 1889.98 |
| 2284.16 |
| 2320.10 |
| 2332.14 |
|
| Intensity |
| 3049 |
| 1390 |
| 2289 |
| 3231 |
| 2894 |
| 1493 |
| 1133 |
| 1126 |
| 1792 |
| 67674 |
| 2220 |
| 54047 |
| 1324 |
| 10246 |
| 8442 |
| 1201 |
| 1199 |
| 1041 |
| 7464 |
| 1032 |
| 7144 |
| 1497 |
| 3051 |
| 2721 |
|
|
(24 total) |
| | matched peaks |
| | contaminants |
|