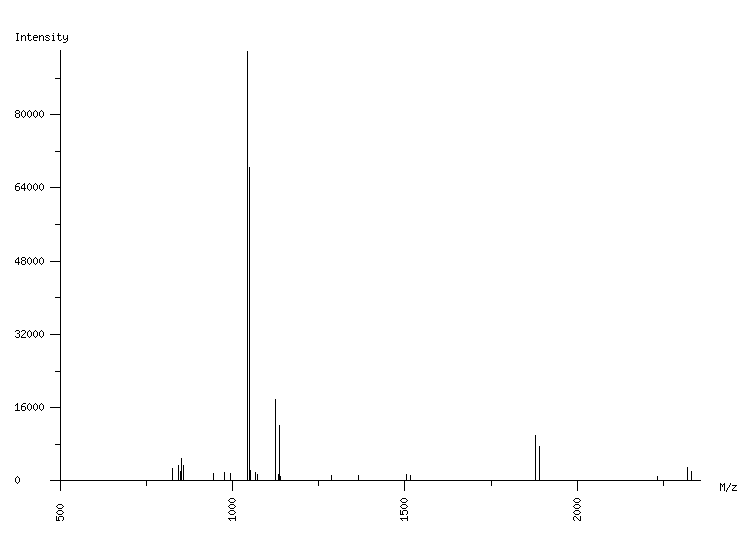
ORGANISM: Homo sapiens
GEL: Human AGS cells; cellular proteins; phosphoproteome
SPOT_ID: 485

|
| M/z |
| 825.11 |
| 845.09 |
| 850.52 |
| 853.43 |
| 859.45 |
| 945.46 |
| 977.48 |
| 995.53 |
| 1043.54 |
| 1048.55 |
| 1049.56 |
| 1052.69 |
| 1065.52 |
| 1071.54 |
| 1123.58 |
| 1133.63 |
| 1135.61 |
| 1139.58 |
| 1287.70 |
| 1366.69 |
| 1504.61 |
| 1516.66 |
| 1877.94 |
| 1889.98 |
| 2233.08 |
| 2320.10 |
| 2332.13 |
|
| Intensity |
| 2706 |
| 3302 |
| 2106 |
| 4882 |
| 3377 |
| 1657 |
| 1779 |
| 1738 |
| 93906 |
| 2581 |
| 68546 |
| 2302 |
| 1873 |
| 1427 |
| 17751 |
| 1424 |
| 12127 |
| 1089 |
| 1181 |
| 1227 |
| 1396 |
| 1122 |
| 9891 |
| 7503 |
| 1039 |
| 3040 |
| 2182 |
|
|
(27 total) |
| | matched peaks |
| | contaminants |
|