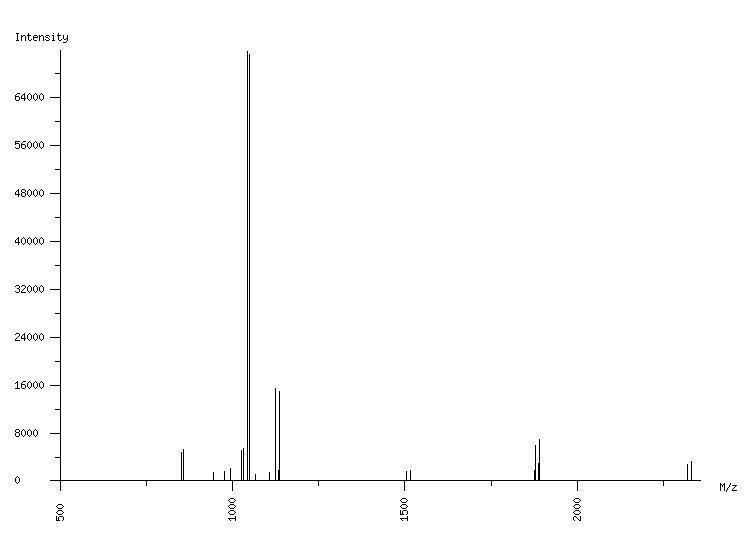
ORGANISM: Homo sapiens
GEL: Human AGS cells; cellular proteins; phosphoproteome
SPOT_ID: 483

|
| M/z |
| 853.44 |
| 859.46 |
| 945.48 |
| 977.49 |
| 995.55 |
| 1025.53 |
| 1031.55 |
| 1043.54 |
| 1048.55 |
| 1049.56 |
| 1065.52 |
| 1107.05 |
| 1123.58 |
| 1134.62 |
| 1135.62 |
| 1504.64 |
| 1516.67 |
| 1876.96 |
| 1877.95 |
| 1889.00 |
| 1889.99 |
| 2320.11 |
| 2332.15 |
|
| Intensity |
| 4740 |
| 5235 |
| 1364 |
| 1581 |
| 2059 |
| 5160 |
| 5488 |
| 71682 |
| 3214 |
| 71154 |
| 1132 |
| 1488 |
| 15435 |
| 1725 |
| 14922 |
| 1641 |
| 1716 |
| 1823 |
| 5886 |
| 2852 |
| 6941 |
| 2777 |
| 3193 |
|
|
(23 total) |
| | matched peaks |
| | contaminants |
|