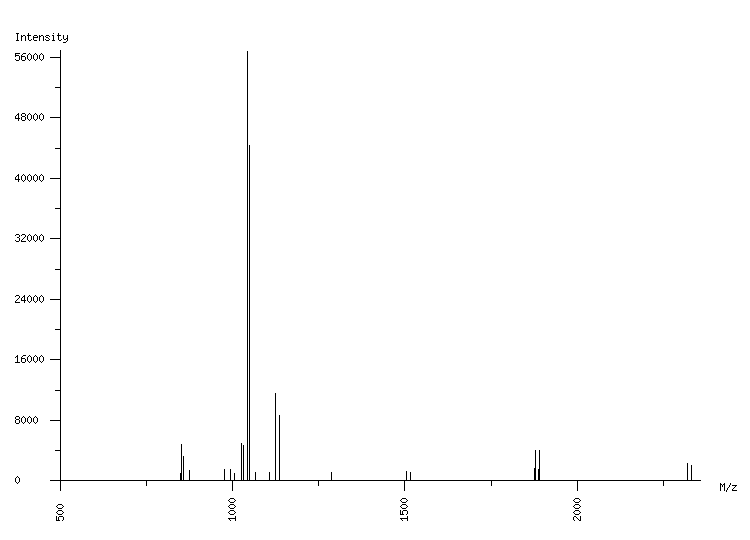
ORGANISM: Homo sapiens
GEL: Human AGS cells; cellular proteins; phosphoproteome
SPOT_ID: 482

|
| M/z |
| 850.52 |
| 853.43 |
| 859.45 |
| 876.27 |
| 977.48 |
| 995.55 |
| 1005.54 |
| 1025.53 |
| 1031.55 |
| 1043.54 |
| 1048.55 |
| 1049.56 |
| 1065.51 |
| 1107.05 |
| 1123.58 |
| 1135.62 |
| 1287.70 |
| 1504.63 |
| 1516.68 |
| 1876.95 |
| 1877.94 |
| 1888.99 |
| 1889.98 |
| 2320.09 |
| 2332.13 |
|
| Intensity |
| 1048 |
| 4850 |
| 3252 |
| 1361 |
| 1514 |
| 1578 |
| 1038 |
| 4954 |
| 4637 |
| 56821 |
| 1590 |
| 44323 |
| 1100 |
| 1064 |
| 11585 |
| 8655 |
| 1123 |
| 1308 |
| 1124 |
| 1664 |
| 4070 |
| 1464 |
| 4066 |
| 2347 |
| 2073 |
|
|
(25 total) |
| | matched peaks |
| | contaminants |
|