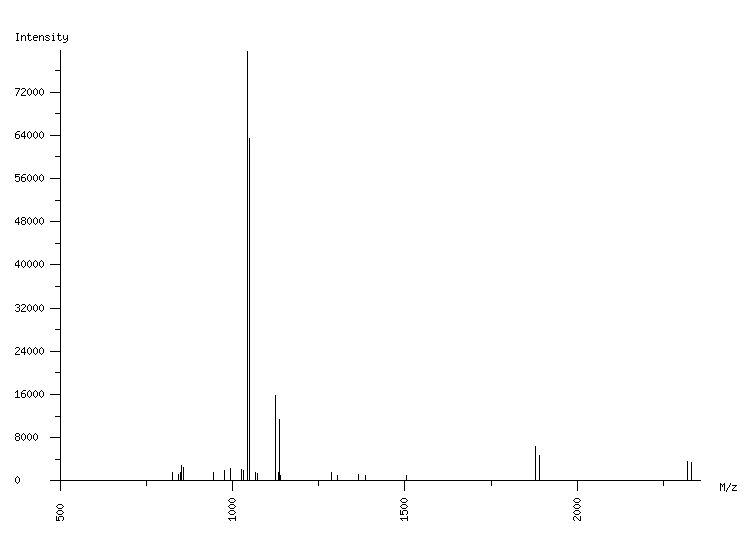
ORGANISM: Homo sapiens
GEL: Human AGS cells; cellular proteins; phosphoproteome
SPOT_ID: 476

|
| M/z |
| 825.09 |
| 826.52 |
| 844.53 |
| 850.51 |
| 853.42 |
| 859.44 |
| 945.45 |
| 977.46 |
| 995.53 |
| 1025.51 |
| 1031.54 |
| 1043.53 |
| 1048.54 |
| 1049.54 |
| 1065.51 |
| 1071.53 |
| 1123.57 |
| 1134.60 |
| 1135.61 |
| 1139.58 |
| 1287.69 |
| 1305.75 |
| 1366.70 |
| 1384.77 |
| 1504.63 |
| 1877.94 |
| 1889.98 |
| 2320.10 |
| 2332.14 |
|
| Intensity |
| 1073 |
| 1604 |
| 1287 |
| 1648 |
| 2909 |
| 2500 |
| 1538 |
| 1969 |
| 2304 |
| 2038 |
| 1945 |
| 79581 |
| 2511 |
| 63388 |
| 1562 |
| 1368 |
| 15853 |
| 1593 |
| 11381 |
| 1012 |
| 1644 |
| 1006 |
| 1271 |
| 1077 |
| 1024 |
| 6388 |
| 4746 |
| 3524 |
| 3420 |
|
|
(29 total) |
| | matched peaks |
| | contaminants |
|