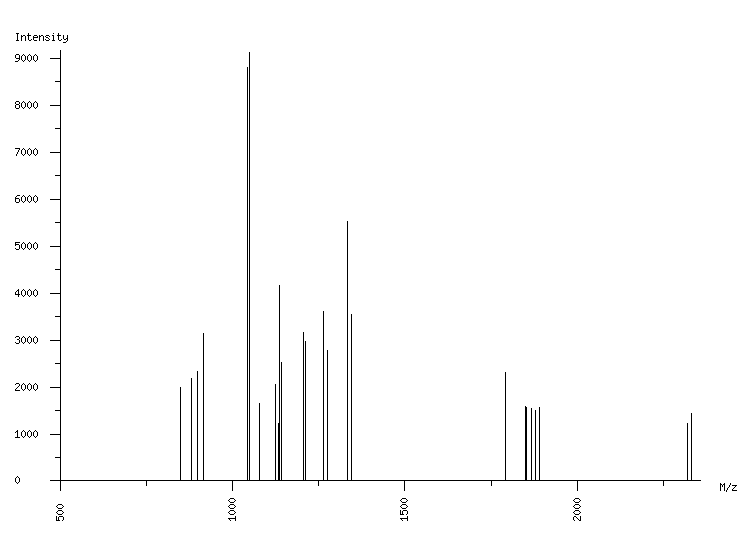
ORGANISM: Homo sapiens
GEL: Human AGS cells; cellular proteins; phosphoproteome
SPOT_ID: 475

|
| M/z |
| 848.52 |
| 850.53 |
| 882.19 |
| 899.77 |
| 917.28 |
| 1043.54 |
| 1049.55 |
| 1077.20 |
| 1123.58 |
| 1134.66 |
| 1135.60 |
| 1141.62 |
| 1206.63 |
| 1212.65 |
| 1263.68 |
| 1275.73 |
| 1334.72 |
| 1346.77 |
| 1791.74 |
| 1849.00 |
| 1851.95 |
| 1867.06 |
| 1877.96 |
| 1889.98 |
| 2320.09 |
| 2332.14 |
|
| Intensity |
| 1195 |
| 1986 |
| 2173 |
| 2333 |
| 3131 |
| 8800 |
| 9132 |
| 1644 |
| 2055 |
| 1224 |
| 4173 |
| 2532 |
| 3171 |
| 2978 |
| 3609 |
| 2785 |
| 5533 |
| 3554 |
| 2316 |
| 1594 |
| 1559 |
| 1548 |
| 1494 |
| 1571 |
| 1217 |
| 1440 |
|
|
(26 total) |
| | matched peaks |
| | contaminants |
|