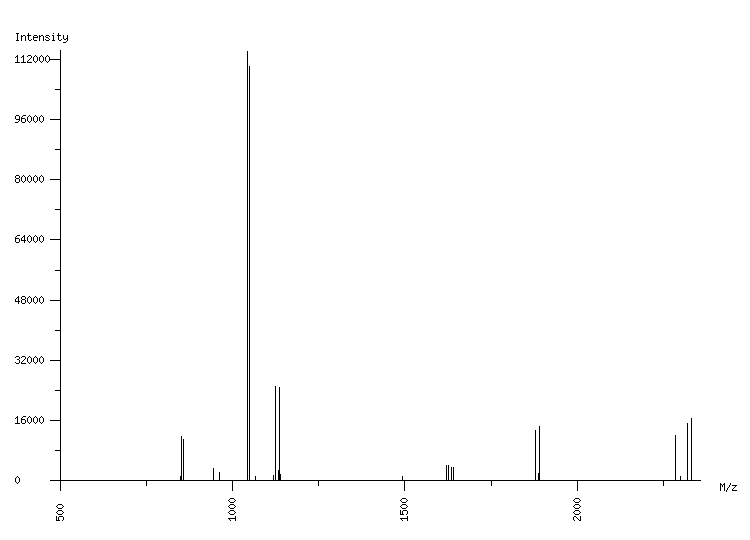
ORGANISM: Homo sapiens
GEL: Human AGS cells; cellular proteins; phosphoproteome
SPOT_ID: 473

|
| M/z |
| 850.52 |
| 853.43 |
| 859.45 |
| 945.46 |
| 963.52 |
| 1043.53 |
| 1048.55 |
| 1049.55 |
| 1065.52 |
| 1119.11 |
| 1123.58 |
| 1134.62 |
| 1135.62 |
| 1139.58 |
| 1493.73 |
| 1621.77 |
| 1627.79 |
| 1635.78 |
| 1641.80 |
| 1877.94 |
| 1888.98 |
| 1889.98 |
| 2284.17 |
| 2300.16 |
| 2320.10 |
| 2331.13 |
| 2332.14 |
|
| Intensity |
| 1196 |
| 11690 |
| 10944 |
| 3402 |
| 2171 |
| 114131 |
| 4027 |
| 110008 |
| 1265 |
| 1552 |
| 24978 |
| 2743 |
| 24951 |
| 1648 |
| 1307 |
| 4056 |
| 4147 |
| 3648 |
| 3579 |
| 13323 |
| 2083 |
| 14507 |
| 12084 |
| 1155 |
| 15202 |
| 1606 |
| 16584 |
|
|
(27 total) |
| | matched peaks |
| | contaminants |
|