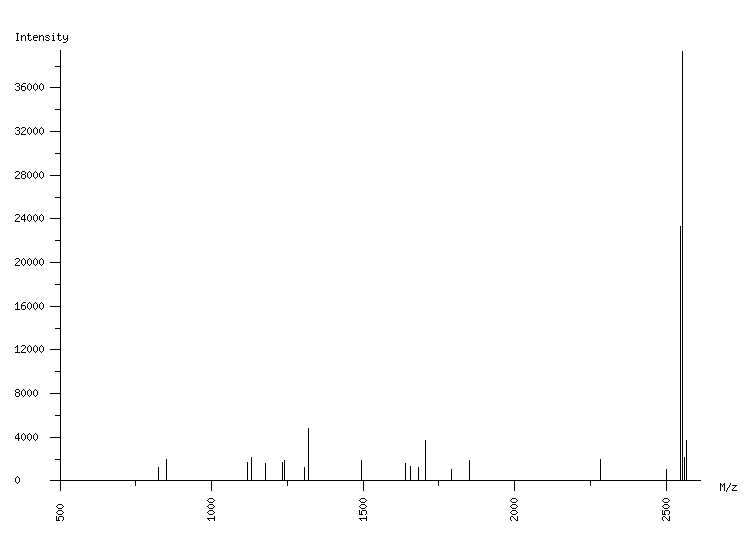
ORGANISM: Homo sapiens
GEL: Human AGS cells; cellular proteins; phosphoproteome
SPOT_ID: 470

|
| M/z |
| 825.08 |
| 850.52 |
| 1118.52 |
| 1130.57 |
| 1179.60 |
| 1235.54 |
| 1239.57 |
| 1307.68 |
| 1320.60 |
| 1493.74 |
| 1638.87 |
| 1657.80 |
| 1681.99 |
| 1707.78 |
| 1791.73 |
| 1851.93 |
| 2284.16 |
| 2501.24 |
| 2547.28 |
| 2553.29 |
| 2559.30 |
| 2562.29 |
| 2567.29 |
|
| Intensity |
| 1230 |
| 1949 |
| 1653 |
| 2178 |
| 1582 |
| 1698 |
| 1860 |
| 1248 |
| 4775 |
| 1903 |
| 1573 |
| 1309 |
| 1239 |
| 3699 |
| 1093 |
| 1840 |
| 2010 |
| 1038 |
| 23341 |
| 39369 |
| 2166 |
| 1439 |
| 3675 |
|
|
(23 total) |
| | matched peaks |
| | contaminants |
|