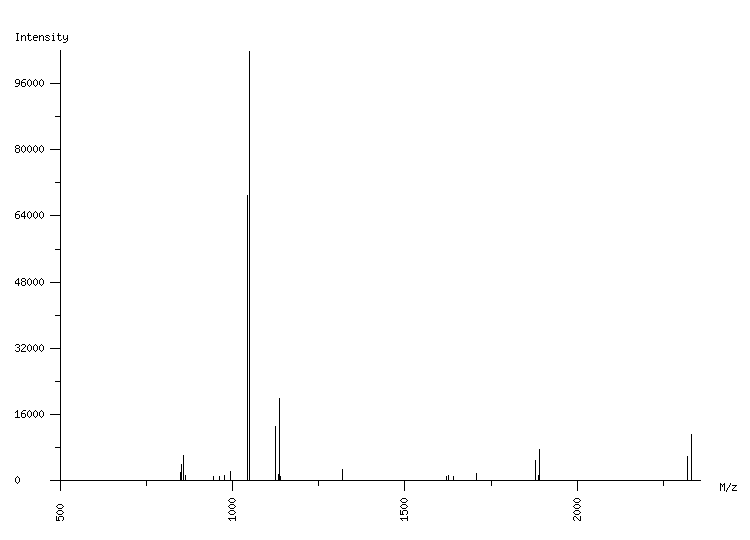
ORGANISM: Homo sapiens
GEL: Human AGS cells; cellular proteins; phosphoproteome
SPOT_ID: 467

|
| M/z |
| 850.52 |
| 853.42 |
| 859.45 |
| 864.52 |
| 945.47 |
| 963.52 |
| 977.48 |
| 995.54 |
| 1043.53 |
| 1048.55 |
| 1049.55 |
| 1123.58 |
| 1134.61 |
| 1135.61 |
| 1139.59 |
| 1320.59 |
| 1621.77 |
| 1627.78 |
| 1641.81 |
| 1707.77 |
| 1877.93 |
| 1888.98 |
| 1889.98 |
| 2320.09 |
| 2332.13 |
|
| Intensity |
| 1934 |
| 3959 |
| 6221 |
| 1229 |
| 1160 |
| 1039 |
| 1266 |
| 2324 |
| 68903 |
| 3907 |
| 103762 |
| 13174 |
| 1544 |
| 20021 |
| 1051 |
| 2701 |
| 1102 |
| 1400 |
| 1125 |
| 1706 |
| 4945 |
| 1223 |
| 7638 |
| 5930 |
| 11110 |
|
|
(25 total) |
| | matched peaks |
| | contaminants |
|