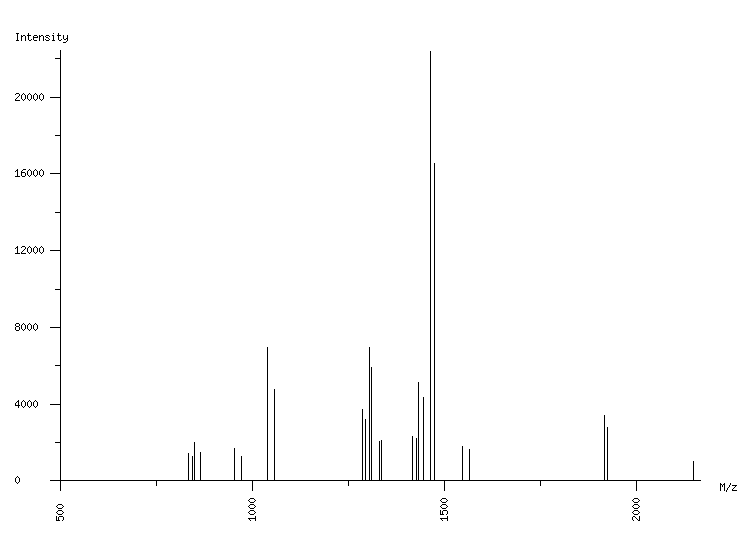
ORGANISM: Homo sapiens
GEL: Human AGS cells; cellular proteins; phosphoproteome
SPOT_ID: 459

|
| M/z |
| 834.33 |
| 845.09 |
| 850.52 |
| 864.52 |
| 953.53 |
| 971.59 |
| 1040.57 |
| 1058.63 |
| 1287.64 |
| 1293.66 |
| 1304.66 |
| 1310.68 |
| 1330.64 |
| 1336.67 |
| 1415.73 |
| 1427.78 |
| 1432.76 |
| 1444.80 |
| 1462.82 |
| 1473.85 |
| 1474.86 |
| 1546.75 |
| 1564.81 |
| 1916.98 |
| 1923.00 |
| 2148.08 |
|
| Intensity |
| 1414 |
| 1297 |
| 2029 |
| 1499 |
| 1688 |
| 1279 |
| 6978 |
| 4765 |
| 3699 |
| 3196 |
| 6977 |
| 5913 |
| 2053 |
| 2101 |
| 2319 |
| 2202 |
| 5129 |
| 4339 |
| 22393 |
| 1694 |
| 16554 |
| 1802 |
| 1641 |
| 3421 |
| 2806 |
| 1008 |
|
|
(26 total) |
| | matched peaks |
| | contaminants |
|