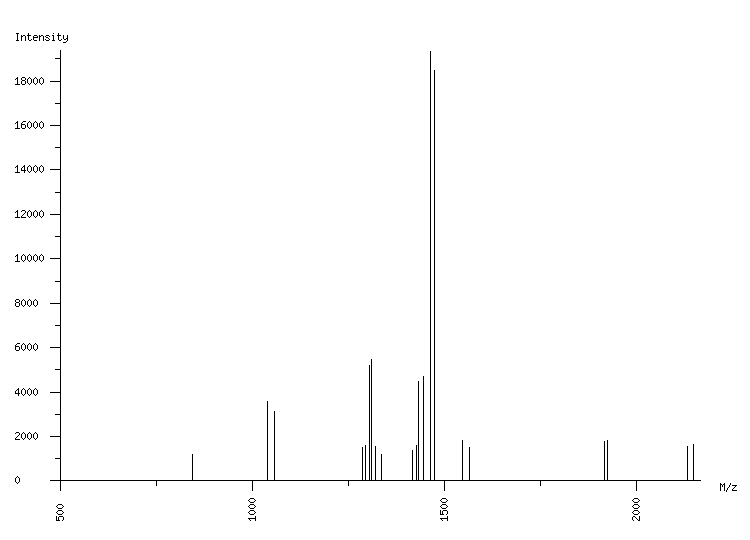
ORGANISM: Homo sapiens
GEL: Human AGS cells; cellular proteins; phosphoproteome
SPOT_ID: 457

|
| M/z |
| 845.08 |
| 845.49 |
| 1040.58 |
| 1058.63 |
| 1287.63 |
| 1293.65 |
| 1304.66 |
| 1310.68 |
| 1321.59 |
| 1336.67 |
| 1415.73 |
| 1427.77 |
| 1432.76 |
| 1444.80 |
| 1462.82 |
| 1473.85 |
| 1474.86 |
| 1546.75 |
| 1564.81 |
| 1916.98 |
| 1923.00 |
| 2132.08 |
| 2148.08 |
|
| Intensity |
| 1174 |
| 1102 |
| 3568 |
| 3127 |
| 1525 |
| 1579 |
| 5189 |
| 5459 |
| 1537 |
| 1174 |
| 1384 |
| 1590 |
| 4490 |
| 4702 |
| 19323 |
| 2238 |
| 18480 |
| 1839 |
| 1523 |
| 1786 |
| 1818 |
| 1569 |
| 1644 |
|
|
(23 total) |
| | matched peaks |
| | contaminants |
|