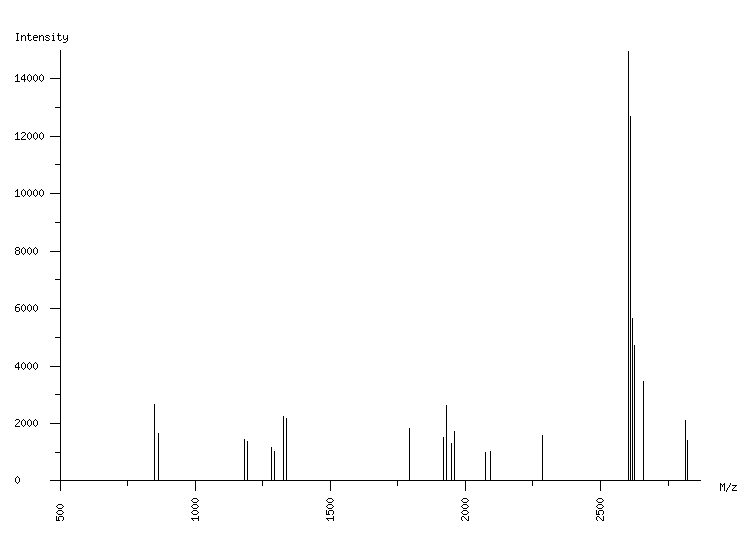
ORGANISM: Homo sapiens
GEL: Human AGS cells; cellular proteins; phosphoproteome
SPOT_ID: 452

|
| M/z |
| 848.52 |
| 850.52 |
| 864.54 |
| 1183.51 |
| 1195.56 |
| 1281.57 |
| 1293.60 |
| 1327.60 |
| 1339.64 |
| 1791.75 |
| 1919.85 |
| 1931.89 |
| 1947.88 |
| 1959.90 |
| 2075.96 |
| 2093.02 |
| 2284.16 |
| 2605.24 |
| 2611.26 |
| 2619.26 |
| 2625.27 |
| 2659.29 |
| 2815.38 |
| 2821.40 |
|
| Intensity |
| 1552 |
| 2664 |
| 1649 |
| 1450 |
| 1382 |
| 1164 |
| 1028 |
| 2240 |
| 2169 |
| 1826 |
| 1498 |
| 2621 |
| 1291 |
| 1716 |
| 1006 |
| 1038 |
| 1580 |
| 14954 |
| 12678 |
| 5640 |
| 4705 |
| 3450 |
| 2091 |
| 1424 |
|
|
(24 total) |
| | matched peaks |
| | contaminants |
|