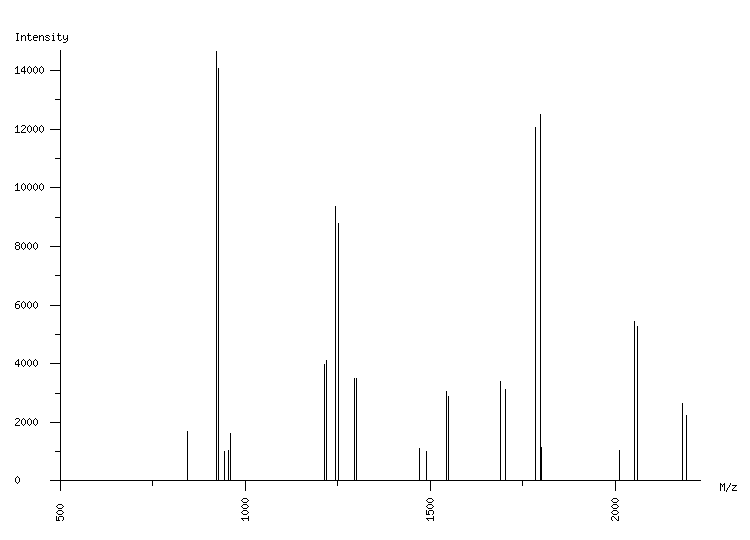
ORGANISM: Homo sapiens
GEL: Human AGS cells; cellular proteins; phosphoproteome
SPOT_ID: 424

|
| M/z |
| 845.08 |
| 922.46 |
| 928.48 |
| 944.46 |
| 954.46 |
| 960.47 |
| 1214.60 |
| 1220.62 |
| 1244.62 |
| 1250.64 |
| 1294.59 |
| 1300.62 |
| 1470.79 |
| 1488.85 |
| 1543.79 |
| 1549.81 |
| 1689.85 |
| 1701.89 |
| 1784.92 |
| 1796.96 |
| 1800.94 |
| 2011.11 |
| 2052.11 |
| 2058.12 |
| 2180.21 |
| 2192.23 |
|
| Intensity |
| 1674 |
| 14640 |
| 14067 |
| 1004 |
| 1044 |
| 1633 |
| 3986 |
| 4121 |
| 9353 |
| 8788 |
| 3498 |
| 3486 |
| 1108 |
| 1008 |
| 3040 |
| 2890 |
| 3391 |
| 3133 |
| 12042 |
| 12513 |
| 1143 |
| 1046 |
| 5451 |
| 5254 |
| 2641 |
| 2250 |
|
|
(26 total) |
| | matched peaks |
| | contaminants |
|