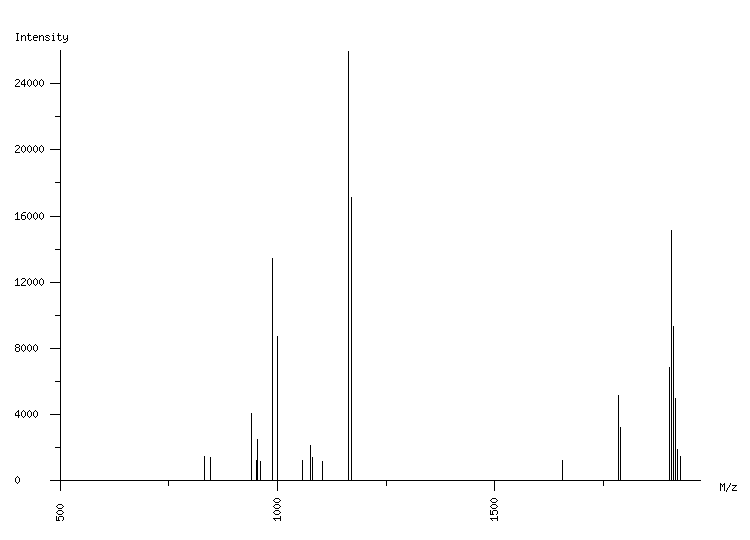
ORGANISM: Homo sapiens
GEL: Human AGS cells; cellular proteins; phosphoproteome
SPOT_ID: 418

|
| M/z |
| 831.50 |
| 845.09 |
| 941.46 |
| 952.43 |
| 953.50 |
| 960.42 |
| 961.44 |
| 987.60 |
| 999.64 |
| 1058.55 |
| 1075.58 |
| 1081.60 |
| 1104.51 |
| 1163.62 |
| 1169.64 |
| 1655.75 |
| 1783.91 |
| 1789.93 |
| 1902.87 |
| 1905.98 |
| 1912.01 |
| 1914.92 |
| 1919.96 |
| 1926.02 |
|
| Intensity |
| 1457 |
| 1400 |
| 4097 |
| 1235 |
| 2477 |
| 1112 |
| 1188 |
| 13466 |
| 8723 |
| 1223 |
| 2142 |
| 1414 |
| 1167 |
| 25932 |
| 17143 |
| 1235 |
| 5175 |
| 3224 |
| 6865 |
| 15150 |
| 9323 |
| 4967 |
| 1920 |
| 1493 |
|
|
(24 total) |
| | matched peaks |
| | contaminants |
|