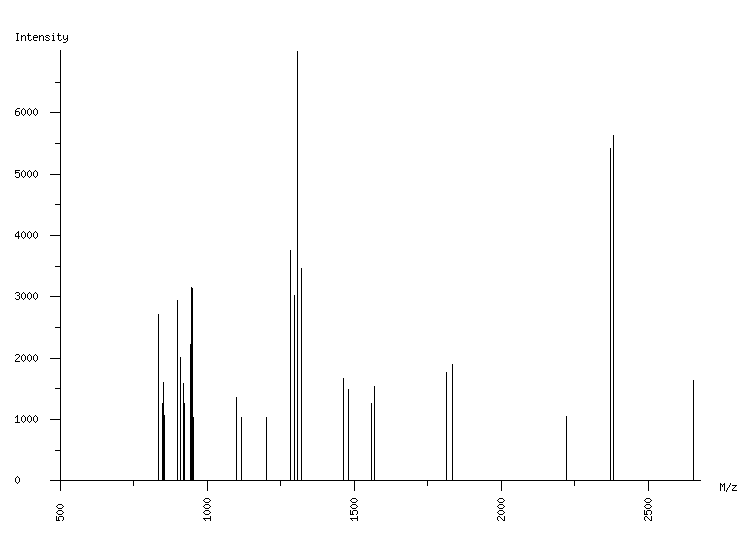
ORGANISM: Homo sapiens
GEL: Human AGS cells; cellular proteins; phosphoproteome
SPOT_ID: 389

|
| M/z |
| 835.50 |
| 848.53 |
| 850.52 |
| 853.56 |
| 855.49 |
| 898.49 |
| 910.52 |
| 918.51 |
| 924.53 |
| 942.45 |
| 945.48 |
| 951.50 |
| 954.50 |
| 1098.55 |
| 1116.62 |
| 1201.68 |
| 1283.59 |
| 1295.63 |
| 1308.62 |
| 1320.66 |
| 1464.71 |
| 1481.84 |
| 1558.84 |
| 1570.88 |
| 1814.89 |
| 1832.96 |
| 2223.11 |
| 2371.13 |
| 2383.17 |
| 2653.29 |
|
| Intensity |
| 2717 |
| 1266 |
| 1279 |
| 1601 |
| 1074 |
| 2949 |
| 2014 |
| 1593 |
| 1269 |
| 2224 |
| 3154 |
| 3139 |
| 1041 |
| 1359 |
| 1041 |
| 1029 |
| 3749 |
| 3027 |
| 6993 |
| 3463 |
| 1674 |
| 1485 |
| 1262 |
| 1547 |
| 1761 |
| 1892 |
| 1057 |
| 5418 |
| 5625 |
| 1645 |
|
|
(30 total) |
| | matched peaks |
| | contaminants |
|