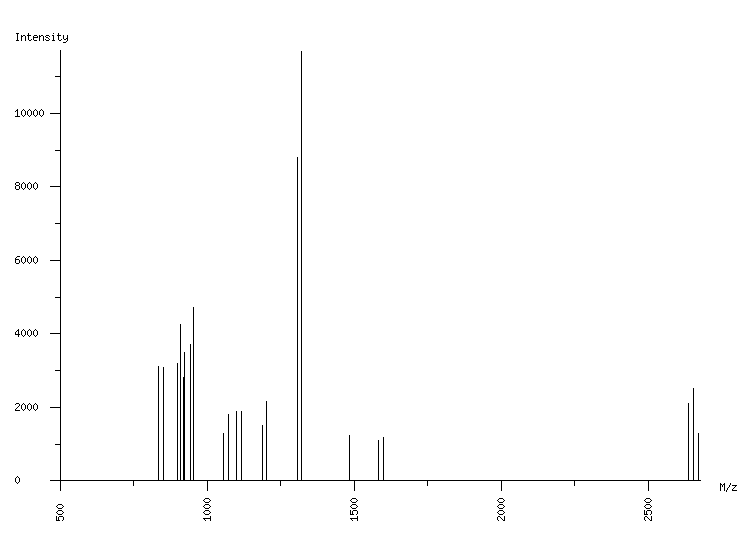
ORGANISM: Homo sapiens
GEL: Human AGS cells; cellular proteins; phosphoproteome
SPOT_ID: 383

|
| M/z |
| 835.49 |
| 852.55 |
| 853.55 |
| 898.48 |
| 910.52 |
| 918.50 |
| 924.52 |
| 942.45 |
| 954.49 |
| 1054.57 |
| 1072.63 |
| 1098.56 |
| 1116.63 |
| 1189.65 |
| 1201.68 |
| 1308.63 |
| 1319.68 |
| 1320.67 |
| 1482.80 |
| 1581.87 |
| 1599.92 |
| 2637.36 |
| 2653.36 |
| 2655.39 |
| 2671.41 |
|
| Intensity |
| 3105 |
| 1049 |
| 3083 |
| 3193 |
| 4266 |
| 2822 |
| 3487 |
| 3707 |
| 4719 |
| 1295 |
| 1802 |
| 1896 |
| 1898 |
| 1520 |
| 2149 |
| 8802 |
| 1819 |
| 11682 |
| 1249 |
| 1097 |
| 1196 |
| 2112 |
| 2310 |
| 2522 |
| 1285 |
|
|
(25 total) |
| | matched peaks |
| | contaminants |
|