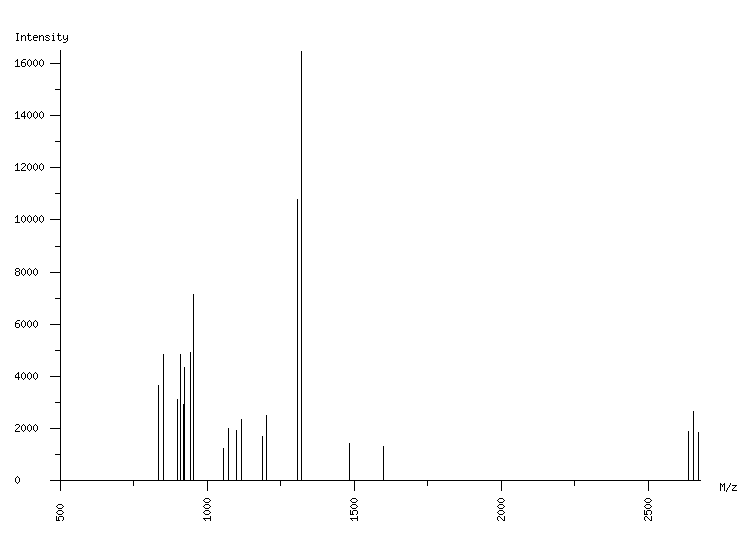
ORGANISM: Homo sapiens
GEL: Human AGS cells; cellular proteins; phosphoproteome
SPOT_ID: 382

|
| M/z |
| 835.49 |
| 853.55 |
| 898.47 |
| 910.52 |
| 918.49 |
| 924.52 |
| 942.45 |
| 953.49 |
| 954.49 |
| 1054.57 |
| 1072.63 |
| 1098.55 |
| 1116.62 |
| 1189.64 |
| 1201.67 |
| 1308.63 |
| 1319.66 |
| 1320.66 |
| 1482.78 |
| 1599.91 |
| 2637.33 |
| 2653.32 |
| 2655.38 |
| 2671.37 |
|
| Intensity |
| 3639 |
| 4834 |
| 3125 |
| 4853 |
| 2931 |
| 4333 |
| 4935 |
| 1032 |
| 7158 |
| 1260 |
| 2012 |
| 1932 |
| 2343 |
| 1699 |
| 2524 |
| 10796 |
| 2624 |
| 16468 |
| 1447 |
| 1339 |
| 1907 |
| 2126 |
| 2677 |
| 1842 |
|
|
(24 total) |
| | matched peaks |
| | contaminants |
|