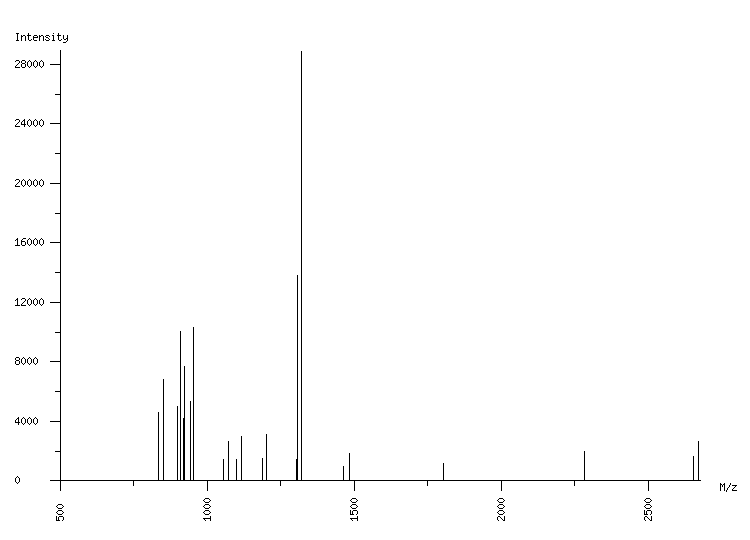
ORGANISM: Homo sapiens
GEL: Human AGS cells; cellular proteins; phosphoproteome
SPOT_ID: 381

|
| M/z |
| 835.49 |
| 850.51 |
| 852.54 |
| 853.54 |
| 898.47 |
| 909.52 |
| 910.51 |
| 918.50 |
| 924.52 |
| 942.43 |
| 953.48 |
| 954.48 |
| 1054.56 |
| 1072.62 |
| 1098.55 |
| 1116.60 |
| 1189.63 |
| 1201.67 |
| 1303.15 |
| 1304.13 |
| 1308.61 |
| 1319.65 |
| 1320.65 |
| 1464.71 |
| 1482.77 |
| 1803.89 |
| 2284.17 |
| 2653.30 |
| 2671.34 |
|
| Intensity |
| 4605 |
| 1056 |
| 1376 |
| 6829 |
| 4989 |
| 1011 |
| 10059 |
| 4172 |
| 7699 |
| 5341 |
| 1127 |
| 10330 |
| 1430 |
| 2682 |
| 1418 |
| 2985 |
| 1512 |
| 3138 |
| 1211 |
| 1457 |
| 13835 |
| 2955 |
| 28878 |
| 1003 |
| 1876 |
| 1191 |
| 1962 |
| 1662 |
| 2657 |
|
|
(29 total) |
| | matched peaks |
| | contaminants |
|