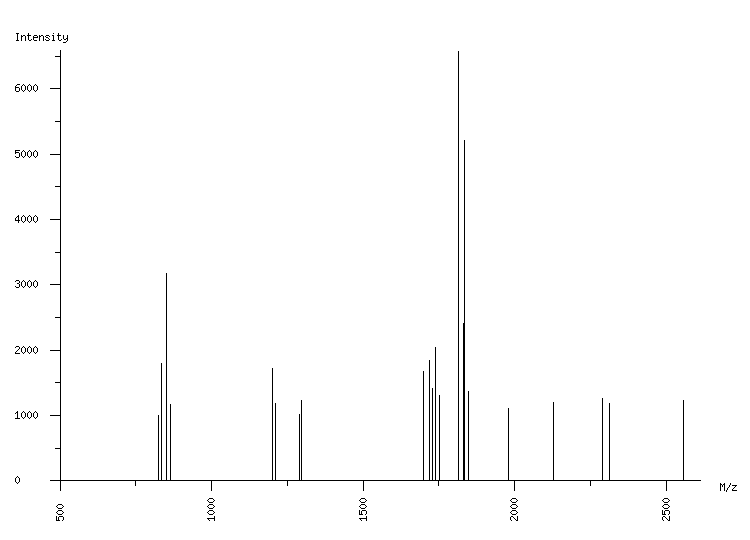
ORGANISM: Homo sapiens
GEL: Human AGS cells; cellular proteins; phosphoproteome
SPOT_ID: 378

|
| M/z |
| 825.11 |
| 834.32 |
| 850.52 |
| 864.54 |
| 1200.70 |
| 1212.75 |
| 1289.74 |
| 1296.80 |
| 1699.88 |
| 1717.94 |
| 1727.89 |
| 1739.93 |
| 1753.94 |
| 1815.90 |
| 1829.91 |
| 1832.98 |
| 1833.96 |
| 1847.98 |
| 1979.07 |
| 2127.08 |
| 2289.19 |
| 2313.28 |
| 2556.35 |
|
| Intensity |
| 1008 |
| 1802 |
| 3167 |
| 1172 |
| 1726 |
| 1182 |
| 1020 |
| 1230 |
| 1673 |
| 1845 |
| 1416 |
| 2043 |
| 1304 |
| 6567 |
| 2402 |
| 1003 |
| 5208 |
| 1363 |
| 1112 |
| 1198 |
| 1265 |
| 1182 |
| 1225 |
|
|
(23 total) |
| | matched peaks |
| | contaminants |
|