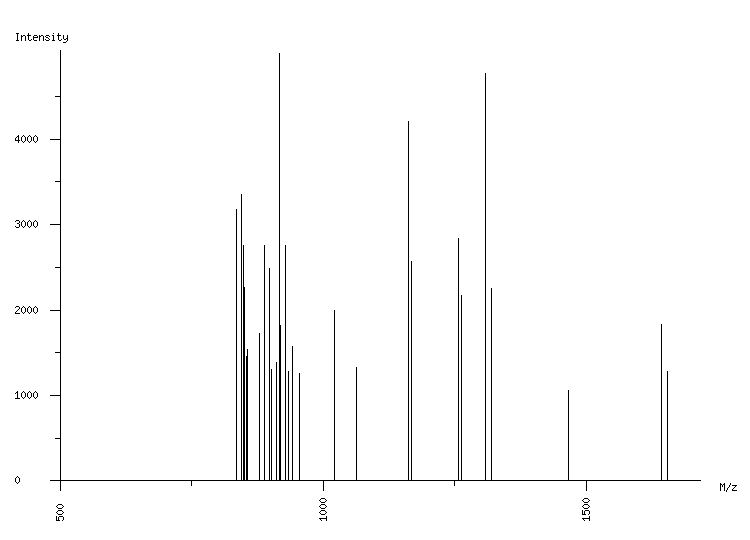
ORGANISM: Homo sapiens
GEL: Human AGS cells; cellular proteins; phosphoproteome
SPOT_ID: 367

|
| M/z |
| 834.51 |
| 835.50 |
| 844.47 |
| 845.08 |
| 848.52 |
| 850.52 |
| 853.54 |
| 855.48 |
| 878.52 |
| 889.46 |
| 898.47 |
| 901.51 |
| 910.50 |
| 916.53 |
| 918.52 |
| 928.57 |
| 934.57 |
| 942.46 |
| 954.49 |
| 1021.58 |
| 1063.63 |
| 1162.55 |
| 1168.57 |
| 1256.70 |
| 1262.72 |
| 1308.62 |
| 1320.65 |
| 1465.72 |
| 1642.77 |
| 1654.82 |
|
| Intensity |
| 2236 |
| 3181 |
| 3352 |
| 2995 |
| 2758 |
| 2258 |
| 1461 |
| 1536 |
| 1726 |
| 2751 |
| 2481 |
| 1303 |
| 1384 |
| 4999 |
| 1816 |
| 2753 |
| 1285 |
| 1571 |
| 1261 |
| 1994 |
| 1333 |
| 4205 |
| 2563 |
| 2835 |
| 2168 |
| 4772 |
| 2252 |
| 1063 |
| 1830 |
| 1276 |
|
|
(30 total) |
| | matched peaks |
| | contaminants |
|