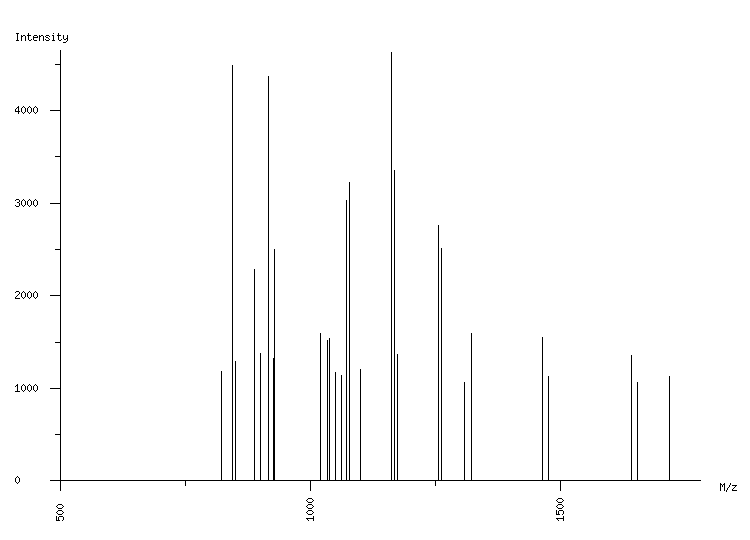
ORGANISM: Homo sapiens
GEL: Human AGS cells; cellular proteins; phosphoproteome
SPOT_ID: 360

|
| M/z |
| 823.11 |
| 844.48 |
| 845.09 |
| 850.52 |
| 889.46 |
| 901.49 |
| 916.53 |
| 927.53 |
| 928.57 |
| 1021.58 |
| 1034.13 |
| 1039.65 |
| 1050.10 |
| 1063.62 |
| 1073.55 |
| 1079.57 |
| 1101.59 |
| 1162.56 |
| 1168.58 |
| 1175.69 |
| 1256.69 |
| 1262.72 |
| 1308.61 |
| 1322.53 |
| 1465.72 |
| 1477.74 |
| 1642.78 |
| 1654.81 |
| 1719.90 |
|
| Intensity |
| 1177 |
| 3268 |
| 4488 |
| 1294 |
| 2287 |
| 1372 |
| 4370 |
| 1323 |
| 2503 |
| 1594 |
| 1517 |
| 1542 |
| 1173 |
| 1136 |
| 3029 |
| 3223 |
| 1202 |
| 4631 |
| 3358 |
| 1361 |
| 2762 |
| 2515 |
| 1067 |
| 1597 |
| 1554 |
| 1129 |
| 1351 |
| 1067 |
| 1128 |
|
|
(29 total) |
| | matched peaks |
| | contaminants |
|