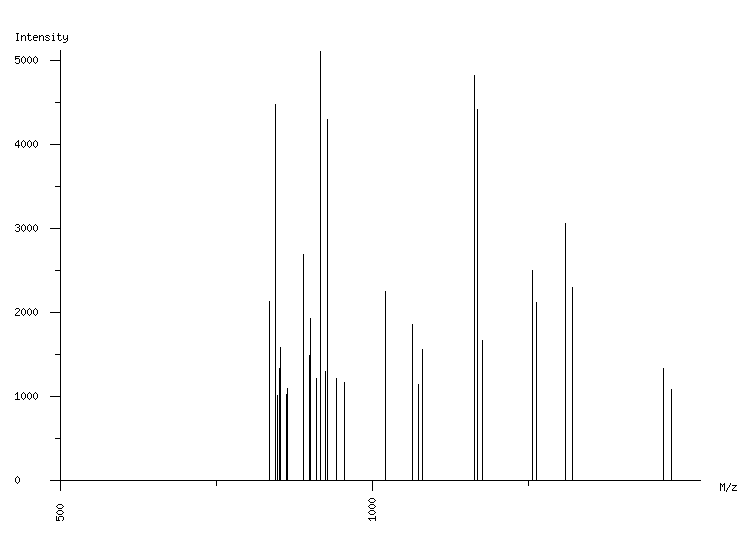
ORGANISM: Homo sapiens
GEL: Human AGS cells; cellular proteins; phosphoproteome
SPOT_ID: 359

|
| M/z |
| 834.41 |
| 835.49 |
| 844.46 |
| 848.52 |
| 850.51 |
| 853.55 |
| 862.44 |
| 864.53 |
| 889.46 |
| 898.49 |
| 901.50 |
| 910.50 |
| 916.53 |
| 924.52 |
| 928.57 |
| 942.46 |
| 954.49 |
| 1021.58 |
| 1063.62 |
| 1073.55 |
| 1079.56 |
| 1162.55 |
| 1168.57 |
| 1175.68 |
| 1256.69 |
| 1262.73 |
| 1308.62 |
| 1320.66 |
| 1465.71 |
| 1477.76 |
|
| Intensity |
| 1112 |
| 2136 |
| 4479 |
| 1021 |
| 1336 |
| 1586 |
| 1033 |
| 1096 |
| 2689 |
| 1495 |
| 1929 |
| 1224 |
| 5111 |
| 1298 |
| 4297 |
| 1218 |
| 1169 |
| 2257 |
| 1859 |
| 1148 |
| 1568 |
| 4821 |
| 4419 |
| 1672 |
| 2508 |
| 2119 |
| 3067 |
| 2297 |
| 1343 |
| 1086 |
|
|
(30 total) |
| | matched peaks |
| | contaminants |
|