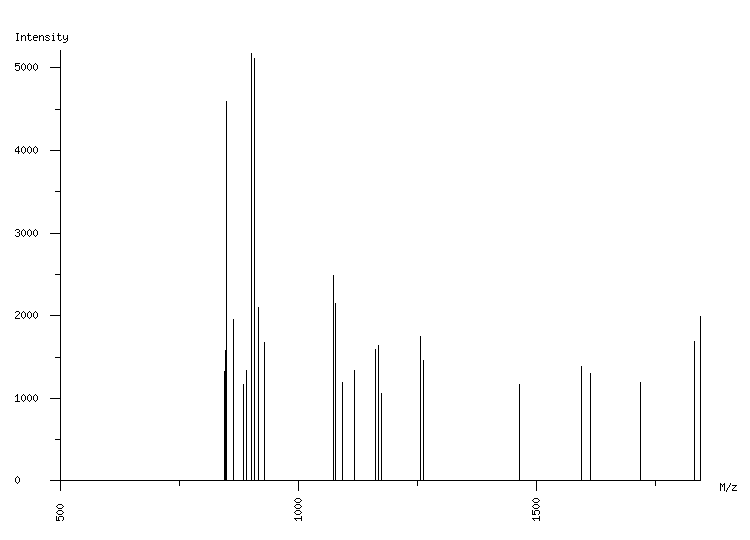
ORGANISM: Homo sapiens
GEL: Human AGS cells; cellular proteins; phosphoproteome
SPOT_ID: 356

|
| M/z |
| 844.49 |
| 848.51 |
| 850.52 |
| 864.54 |
| 885.39 |
| 891.41 |
| 901.39 |
| 907.40 |
| 916.53 |
| 928.57 |
| 1073.55 |
| 1079.56 |
| 1093.56 |
| 1117.65 |
| 1162.56 |
| 1168.56 |
| 1175.68 |
| 1256.70 |
| 1262.72 |
| 1465.71 |
| 1595.96 |
| 1614.02 |
| 1719.91 |
| 1831.96 |
| 1844.00 |
|
| Intensity |
| 1329 |
| 1574 |
| 4597 |
| 1955 |
| 1167 |
| 1339 |
| 5167 |
| 5106 |
| 2096 |
| 1674 |
| 2490 |
| 2146 |
| 1188 |
| 1340 |
| 1587 |
| 1633 |
| 1057 |
| 1744 |
| 1455 |
| 1168 |
| 1383 |
| 1295 |
| 1187 |
| 1686 |
| 1991 |
|
|
(25 total) |
| | matched peaks |
| | contaminants |
|