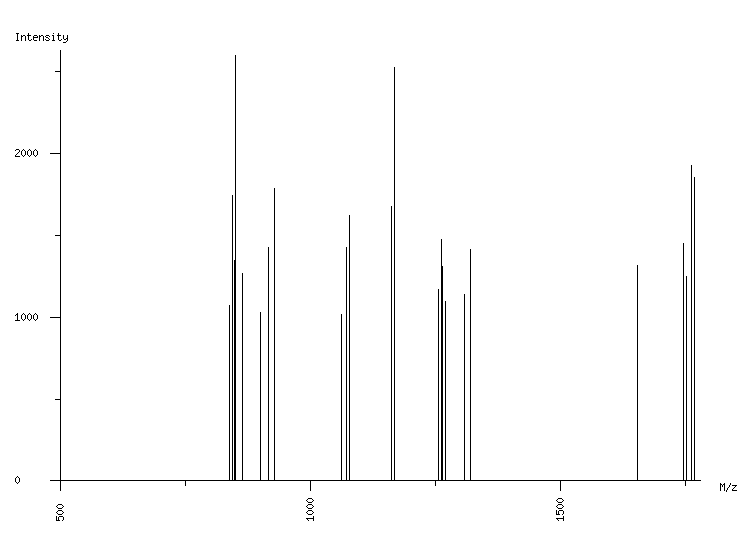
ORGANISM: Homo sapiens
GEL: Human AGS cells; cellular proteins; phosphoproteome
SPOT_ID: 352

|
| M/z |
| 838.50 |
| 844.47 |
| 845.08 |
| 848.51 |
| 850.52 |
| 864.54 |
| 901.51 |
| 916.53 |
| 928.56 |
| 1063.62 |
| 1073.53 |
| 1079.56 |
| 1162.55 |
| 1168.57 |
| 1256.69 |
| 1262.72 |
| 1264.62 |
| 1270.64 |
| 1308.62 |
| 1320.64 |
| 1654.84 |
| 1747.89 |
| 1753.91 |
| 1763.87 |
| 1769.89 |
|
| Intensity |
| 1071 |
| 1742 |
| 1247 |
| 1342 |
| 2593 |
| 1266 |
| 1030 |
| 1426 |
| 1781 |
| 1015 |
| 1426 |
| 1620 |
| 1674 |
| 2521 |
| 1169 |
| 1472 |
| 1305 |
| 1092 |
| 1135 |
| 1410 |
| 1311 |
| 1449 |
| 1249 |
| 1925 |
| 1850 |
|
|
(25 total) |
| | matched peaks |
| | contaminants |
|