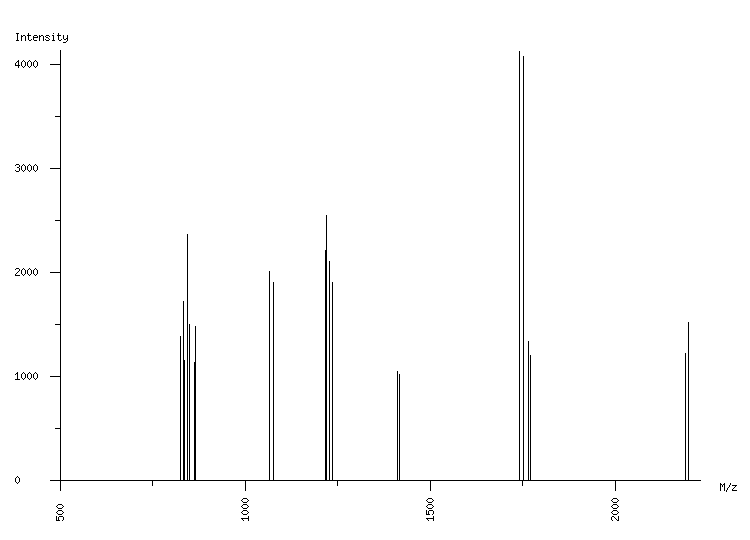
ORGANISM: Homo sapiens
GEL: Human AGS cells; cellular proteins; phosphoproteome
SPOT_ID: 341

|
| M/z |
| 825.48 |
| 826.54 |
| 834.52 |
| 836.51 |
| 845.09 |
| 848.53 |
| 850.52 |
| 862.52 |
| 864.53 |
| 866.51 |
| 1065.59 |
| 1077.21 |
| 1077.64 |
| 1215.65 |
| 1218.70 |
| 1227.69 |
| 1235.78 |
| 1236.77 |
| 1411.79 |
| 1417.81 |
| 1739.94 |
| 1751.99 |
| 1763.81 |
| 1769.82 |
| 2190.04 |
| 2196.07 |
|
| Intensity |
| 1070 |
| 1383 |
| 1723 |
| 1154 |
| 2365 |
| 1233 |
| 1504 |
| 1136 |
| 1479 |
| 1004 |
| 2011 |
| 1025 |
| 1908 |
| 2214 |
| 2545 |
| 2102 |
| 1146 |
| 1901 |
| 1054 |
| 1019 |
| 4123 |
| 4078 |
| 1339 |
| 1205 |
| 1225 |
| 1523 |
|
|
(26 total) |
| | matched peaks |
| | contaminants |
|