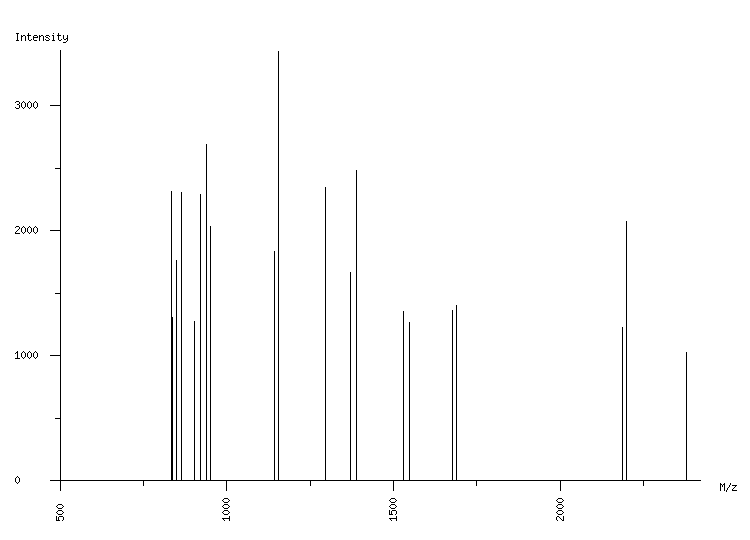
ORGANISM: Homo sapiens
GEL: Human AGS cells; cellular proteins; phosphoproteome
SPOT_ID: 329

|
| M/z |
| 834.54 |
| 836.49 |
| 848.53 |
| 850.51 |
| 864.52 |
| 904.47 |
| 922.59 |
| 939.60 |
| 940.63 |
| 951.64 |
| 1144.52 |
| 1144.67 |
| 1156.73 |
| 1296.69 |
| 1371.85 |
| 1389.91 |
| 1529.80 |
| 1547.87 |
| 1677.84 |
| 1689.88 |
| 2186.05 |
| 2198.09 |
| 2380.34 |
|
| Intensity |
| 2318 |
| 1304 |
| 1157 |
| 1762 |
| 2308 |
| 1278 |
| 2293 |
| 2692 |
| 1728 |
| 2037 |
| 1247 |
| 1832 |
| 3438 |
| 2350 |
| 1665 |
| 2480 |
| 1357 |
| 1267 |
| 1366 |
| 1406 |
| 1229 |
| 2072 |
| 1025 |
|
|
(23 total) |
| | matched peaks |
| | contaminants |
|