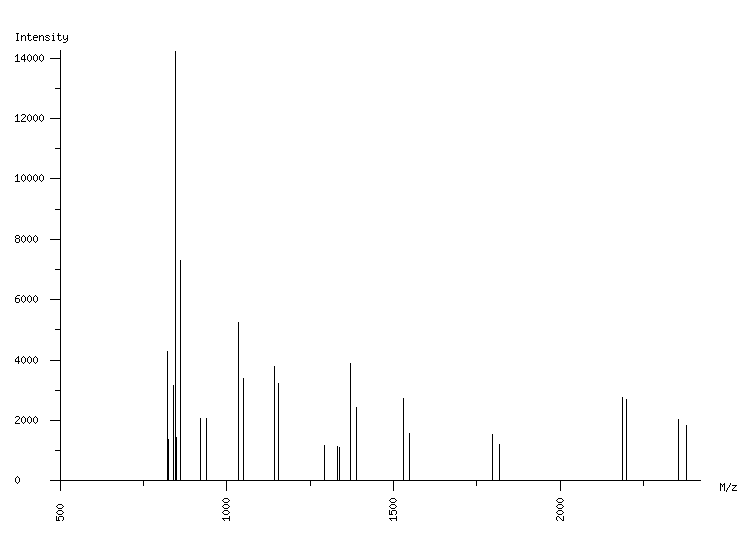
ORGANISM: Homo sapiens
GEL: Human AGS cells; cellular proteins; phosphoproteome
SPOT_ID: 328

|
| M/z |
| 823.12 |
| 825.12 |
| 839.09 |
| 845.11 |
| 847.11 |
| 850.53 |
| 861.09 |
| 922.59 |
| 939.61 |
| 940.64 |
| 1034.15 |
| 1036.15 |
| 1050.12 |
| 1144.69 |
| 1156.73 |
| 1294.78 |
| 1333.64 |
| 1339.65 |
| 1371.86 |
| 1389.92 |
| 1529.81 |
| 1547.87 |
| 1798.96 |
| 1817.03 |
| 2186.04 |
| 2198.08 |
| 2356.25 |
| 2380.33 |
|
| Intensity |
| 4300 |
| 1360 |
| 3156 |
| 14209 |
| 1526 |
| 1438 |
| 7296 |
| 2055 |
| 2074 |
| 1840 |
| 5248 |
| 1029 |
| 3395 |
| 3781 |
| 3235 |
| 1173 |
| 1152 |
| 1106 |
| 3887 |
| 2430 |
| 2714 |
| 1588 |
| 1525 |
| 1202 |
| 2754 |
| 2685 |
| 2028 |
| 1829 |
|
|
(28 total) |
| | matched peaks |
| | contaminants |
|