ORGANISM: Homo sapiens
GEL: Human AGS cells; cellular proteins; phosphoproteome
SPOT_ID: 325

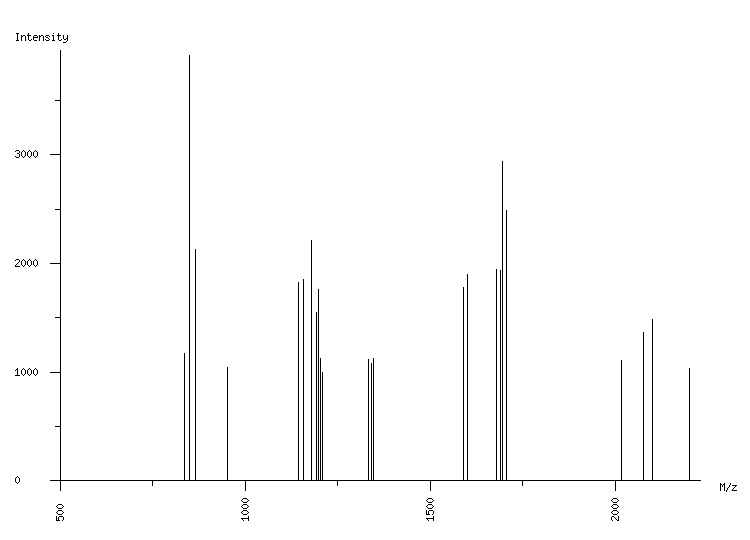
|
| M/z |
| 836.47 |
| 848.52 |
| 850.52 |
| 864.53 |
| 865.49 |
| 951.61 |
| 1144.52 |
| 1156.56 |
| 1179.57 |
| 1192.48 |
| 1193.51 |
| 1197.63 |
| 1203.47 |
| 1209.49 |
| 1333.66 |
| 1340.69 |
| 1346.71 |
| 1588.80 |
| 1600.84 |
| 1677.84 |
| 1689.88 |
| 1693.83 |
| 1705.86 |
| 2015.29 |
| 2075.08 |
| 2099.14 |
| 2200.22 |
|
| Intensity |
| 1174 |
| 2656 |
| 3916 |
| 2131 |
| 1227 |
| 1043 |
| 1824 |
| 1852 |
| 2214 |
| 1554 |
| 1413 |
| 1757 |
| 1125 |
| 1001 |
| 1121 |
| 1077 |
| 1127 |
| 1776 |
| 1900 |
| 1941 |
| 1933 |
| 2935 |
| 2485 |
| 1107 |
| 1367 |
| 1488 |
| 1033 |
|
|
(27 total) |
| | matched peaks |
| | contaminants |
|