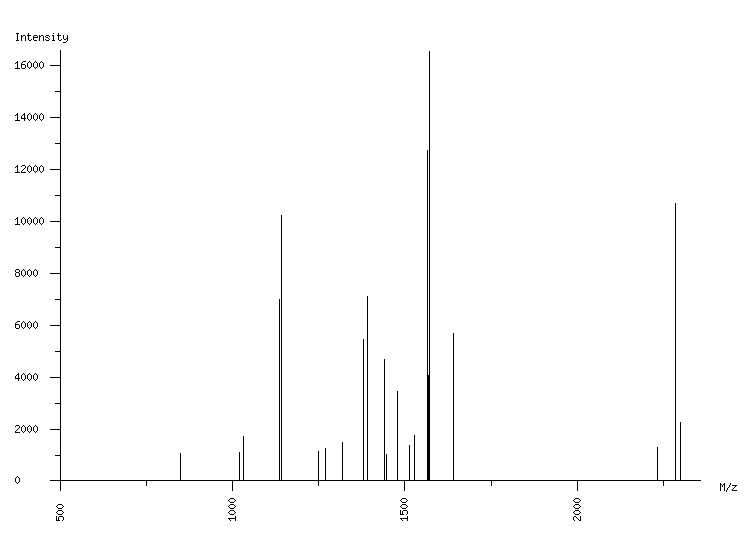
ORGANISM: Homo sapiens
GEL: Human AGS cells; cellular proteins; phosphoproteome
SPOT_ID: 310

|
| M/z |
| 850.53 |
| 1021.55 |
| 1033.58 |
| 1135.57 |
| 1141.59 |
| 1250.72 |
| 1268.78 |
| 1320.65 |
| 1378.70 |
| 1390.74 |
| 1439.82 |
| 1446.64 |
| 1479.80 |
| 1514.62 |
| 1526.67 |
| 1566.80 |
| 1567.78 |
| 1572.82 |
| 1639.94 |
| 2233.08 |
| 2284.17 |
| 2300.17 |
|
| Intensity |
| 1043 |
| 1114 |
| 1724 |
| 6989 |
| 10235 |
| 1124 |
| 1248 |
| 1480 |
| 5460 |
| 7120 |
| 4664 |
| 1020 |
| 3432 |
| 1363 |
| 1743 |
| 12715 |
| 4051 |
| 16546 |
| 5686 |
| 1308 |
| 10665 |
| 2235 |
|
|
(22 total) |
| | matched peaks |
| | contaminants |
|