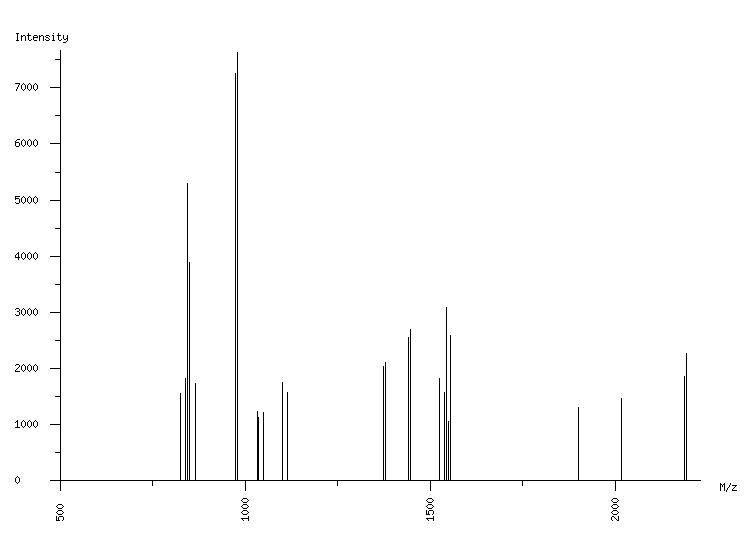
ORGANISM: Homo sapiens
GEL: Human AGS cells; cellular proteins; phosphoproteome
SPOT_ID: 308

|
| M/z |
| 825.11 |
| 839.08 |
| 845.10 |
| 848.51 |
| 850.52 |
| 864.54 |
| 973.59 |
| 979.60 |
| 1033.69 |
| 1035.62 |
| 1050.11 |
| 1101.69 |
| 1113.72 |
| 1373.73 |
| 1379.75 |
| 1439.70 |
| 1445.72 |
| 1525.80 |
| 1537.85 |
| 1542.82 |
| 1548.74 |
| 1554.86 |
| 1901.24 |
| 2015.28 |
| 2185.05 |
| 2191.07 |
|
| Intensity |
| 1552 |
| 1825 |
| 5293 |
| 2019 |
| 3892 |
| 1742 |
| 7249 |
| 7625 |
| 1237 |
| 1126 |
| 1226 |
| 1757 |
| 1566 |
| 2032 |
| 2111 |
| 2550 |
| 2694 |
| 1827 |
| 1577 |
| 3083 |
| 1056 |
| 2581 |
| 1304 |
| 1477 |
| 1859 |
| 2276 |
|
|
(26 total) |
| | matched peaks |
| | contaminants |
|