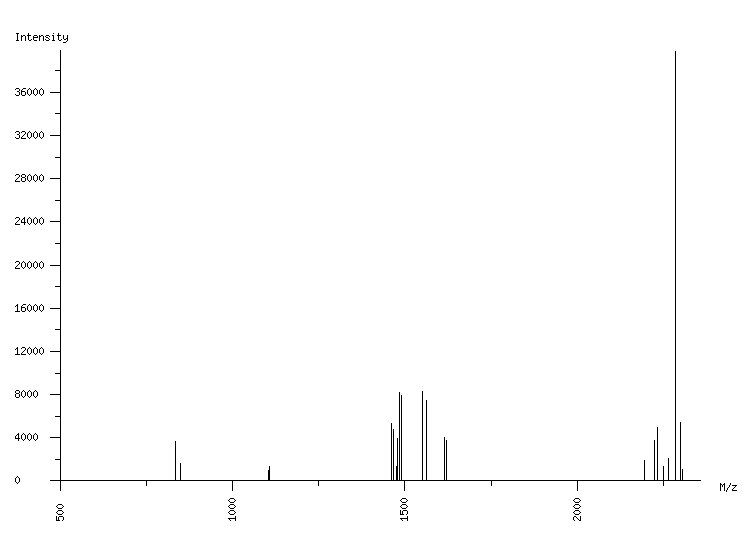
ORGANISM: Homo sapiens
GEL: Human AGS cells; cellular proteins; phosphoproteome
SPOT_ID: 293

|
| M/z |
| 834.32 |
| 850.51 |
| 1106.03 |
| 1106.54 |
| 1461.74 |
| 1467.77 |
| 1475.76 |
| 1477.74 |
| 1483.75 |
| 1484.73 |
| 1490.74 |
| 1549.89 |
| 1561.93 |
| 1614.83 |
| 1620.85 |
| 2193.61 |
| 2194.57 |
| 2225.11 |
| 2233.09 |
| 2249.06 |
| 2265.03 |
| 2284.17 |
| 2300.16 |
| 2305.15 |
|
| Intensity |
| 3632 |
| 1661 |
| 1000 |
| 1301 |
| 5283 |
| 4750 |
| 1311 |
| 3912 |
| 4495 |
| 8190 |
| 7953 |
| 8289 |
| 7448 |
| 4039 |
| 3757 |
| 1134 |
| 1855 |
| 3752 |
| 4979 |
| 1328 |
| 2064 |
| 39808 |
| 5437 |
| 1100 |
|
|
(24 total) |
| | matched peaks |
| | contaminants |
|