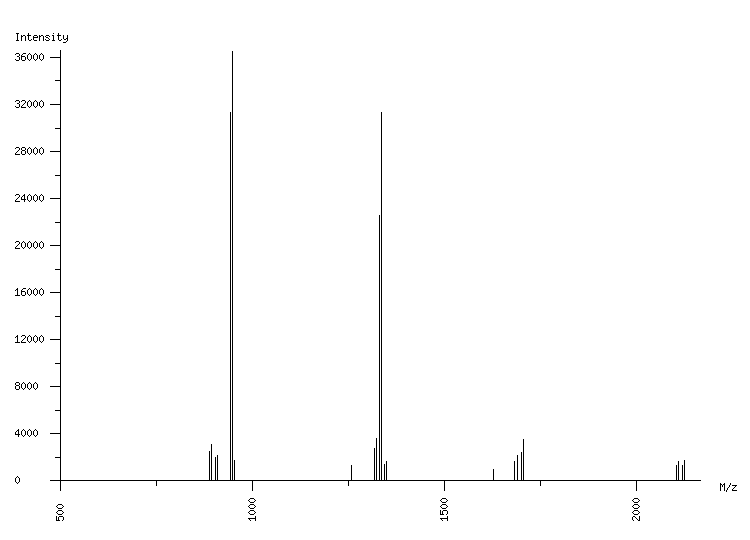
ORGANISM: Homo sapiens
GEL: Human AGS cells; cellular proteins; phosphoproteome
SPOT_ID: 273

|
| M/z |
| 887.40 |
| 893.42 |
| 903.39 |
| 909.40 |
| 943.57 |
| 948.59 |
| 949.58 |
| 954.60 |
| 1256.65 |
| 1316.78 |
| 1322.80 |
| 1329.66 |
| 1334.67 |
| 1335.68 |
| 1343.67 |
| 1349.69 |
| 1627.71 |
| 1682.90 |
| 1688.93 |
| 1698.90 |
| 1704.92 |
| 2101.89 |
| 2107.90 |
| 2117.87 |
| 2123.89 |
|
| Intensity |
| 2521 |
| 3111 |
| 1982 |
| 2136 |
| 31311 |
| 1317 |
| 36520 |
| 1704 |
| 1309 |
| 2771 |
| 3579 |
| 22563 |
| 1168 |
| 31288 |
| 1373 |
| 1660 |
| 1010 |
| 1687 |
| 2158 |
| 2405 |
| 3568 |
| 1316 |
| 1692 |
| 1344 |
| 1747 |
|
|
(25 total) |
| | matched peaks |
| | contaminants |
|