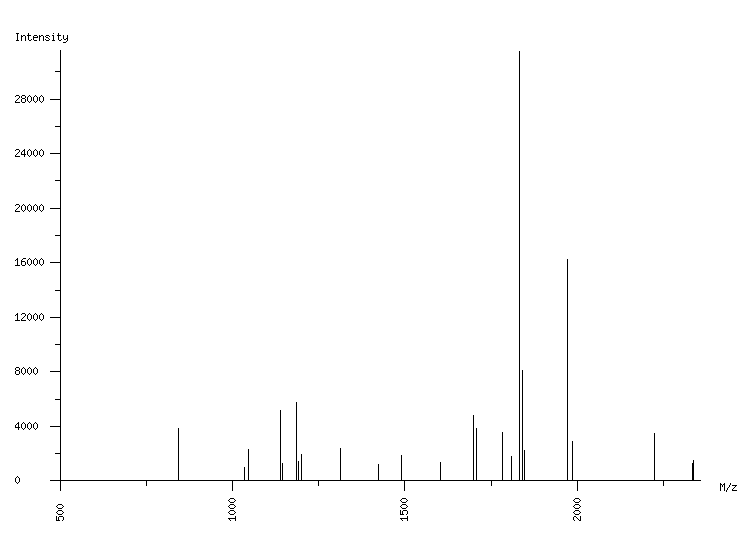
ORGANISM: Homo sapiens
GEL: Human AGS cells; cellular proteins; phosphoproteome
SPOT_ID: 244

|
| M/z |
| 845.09 |
| 1034.12 |
| 1046.49 |
| 1140.57 |
| 1146.59 |
| 1185.64 |
| 1191.66 |
| 1199.65 |
| 1312.70 |
| 1422.59 |
| 1490.74 |
| 1604.78 |
| 1698.89 |
| 1707.73 |
| 1782.78 |
| 1809.96 |
| 1833.88 |
| 1839.90 |
| 1847.89 |
| 1972.98 |
| 1985.01 |
| 2225.11 |
| 2335.18 |
| 2337.12 |
|
| Intensity |
| 3868 |
| 1015 |
| 2301 |
| 5155 |
| 1267 |
| 5724 |
| 1444 |
| 1961 |
| 2369 |
| 1223 |
| 1904 |
| 1325 |
| 4810 |
| 3843 |
| 3531 |
| 1817 |
| 31477 |
| 8116 |
| 2247 |
| 16247 |
| 2903 |
| 3498 |
| 1297 |
| 1471 |
|
|
(24 total) |
| | matched peaks |
| | contaminants |
|