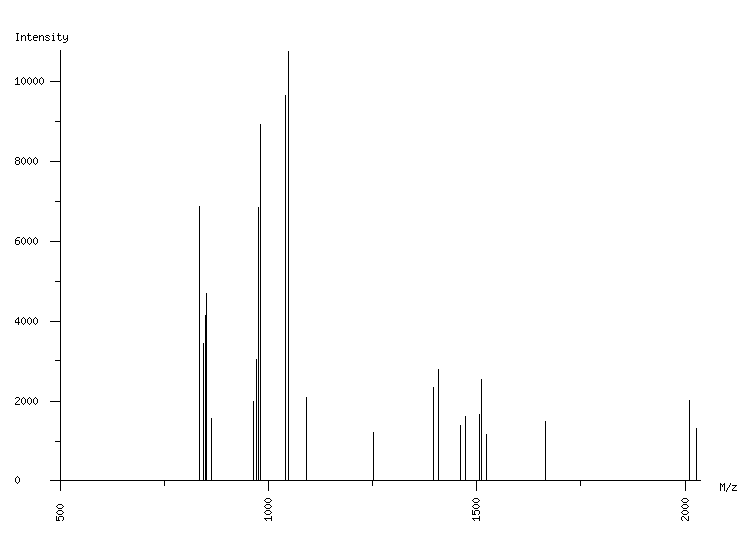
ORGANISM: Homo sapiens
GEL: Human AGS cells; cellular proteins; phosphoproteome
SPOT_ID: 221

|
| M/z |
| 834.57 |
| 845.11 |
| 848.56 |
| 850.56 |
| 852.55 |
| 864.56 |
| 965.50 |
| 971.51 |
| 975.47 |
| 981.49 |
| 1041.63 |
| 1047.65 |
| 1092.66 |
| 1251.69 |
| 1395.77 |
| 1407.80 |
| 1461.81 |
| 1473.79 |
| 1506.78 |
| 1512.79 |
| 1522.79 |
| 1665.91 |
| 2010.14 |
| 2028.20 |
|
| Intensity |
| 6850 |
| 3433 |
| 4148 |
| 4690 |
| 1630 |
| 1566 |
| 1998 |
| 3040 |
| 6849 |
| 8922 |
| 9641 |
| 10729 |
| 2086 |
| 1206 |
| 2330 |
| 2776 |
| 1388 |
| 1608 |
| 1671 |
| 2530 |
| 1161 |
| 1490 |
| 2018 |
| 1323 |
|
|
(24 total) |
| | matched peaks |
| | contaminants |
|