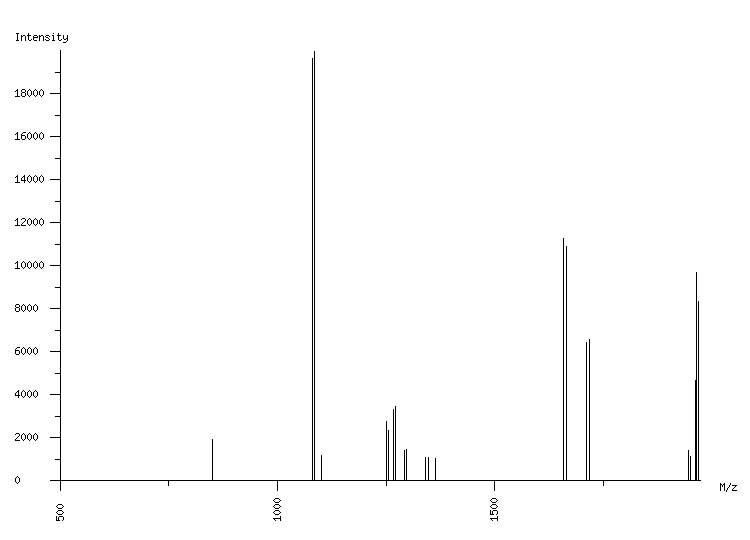
ORGANISM: Homo sapiens
GEL: Human AGS cells; cellular proteins; phosphoproteome
SPOT_ID: 216

|
| M/z |
| 850.52 |
| 1080.46 |
| 1086.48 |
| 1100.50 |
| 1250.66 |
| 1256.68 |
| 1266.65 |
| 1272.66 |
| 1291.69 |
| 1297.70 |
| 1340.69 |
| 1346.71 |
| 1362.70 |
| 1657.89 |
| 1663.91 |
| 1711.94 |
| 1717.97 |
| 1944.99 |
| 1951.00 |
| 1962.01 |
| 1963.00 |
| 1968.02 |
| 1969.01 |
|
| Intensity |
| 1947 |
| 19649 |
| 19960 |
| 1173 |
| 2778 |
| 2352 |
| 3311 |
| 3465 |
| 1433 |
| 1483 |
| 1106 |
| 1111 |
| 1037 |
| 11280 |
| 10898 |
| 6442 |
| 6569 |
| 1439 |
| 1147 |
| 4668 |
| 9710 |
| 5557 |
| 8360 |
|
|
(23 total) |
| | matched peaks |
| | contaminants |
|