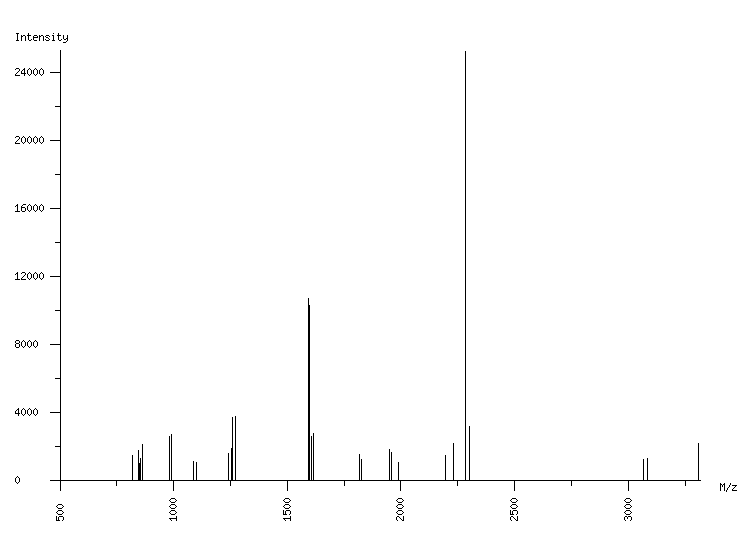
ORGANISM: Homo sapiens
GEL: Human AGS cells; cellular proteins; phosphoproteome
SPOT_ID: 214

|
| M/z |
| 817.58 |
| 846.50 |
| 850.52 |
| 854.29 |
| 864.56 |
| 983.49 |
| 989.51 |
| 1088.60 |
| 1100.64 |
| 1242.63 |
| 1254.66 |
| 1258.62 |
| 1270.66 |
| 1593.83 |
| 1599.86 |
| 1607.85 |
| 1613.88 |
| 1819.88 |
| 1825.91 |
| 1947.99 |
| 1960.02 |
| 1988.99 |
| 2194.56 |
| 2233.09 |
| 2284.17 |
| 2300.17 |
| 3068.42 |
| 3083.45 |
| 3309.68 |
|
| Intensity |
| 1497 |
| 1771 |
| 1053 |
| 1338 |
| 2120 |
| 2621 |
| 2742 |
| 1126 |
| 1065 |
| 1622 |
| 1885 |
| 3752 |
| 3762 |
| 10704 |
| 10313 |
| 2630 |
| 2804 |
| 1575 |
| 1287 |
| 1828 |
| 1646 |
| 1070 |
| 1514 |
| 2203 |
| 25199 |
| 3186 |
| 1254 |
| 1312 |
| 2174 |
|
|
(29 total) |
| | matched peaks |
| | contaminants |
|