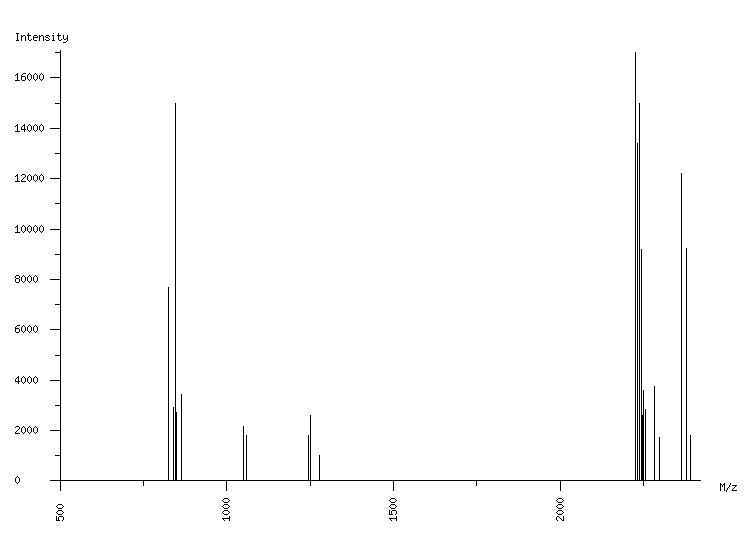
ORGANISM: Homo sapiens
GEL: Human AGS cells; cellular proteins; phosphoproteome
SPOT_ID: 209

|
| M/z |
| 825.11 |
| 839.09 |
| 845.10 |
| 847.10 |
| 850.53 |
| 864.50 |
| 1050.11 |
| 1060.67 |
| 1244.64 |
| 1250.65 |
| 1277.11 |
| 2225.12 |
| 2233.08 |
| 2237.90 |
| 2243.91 |
| 2248.09 |
| 2251.92 |
| 2255.00 |
| 2257.97 |
| 2284.17 |
| 2298.17 |
| 2365.99 |
| 2378.03 |
| 2392.06 |
|
| Intensity |
| 7700 |
| 2930 |
| 14998 |
| 1690 |
| 2736 |
| 3443 |
| 2160 |
| 1806 |
| 1791 |
| 2583 |
| 1028 |
| 17028 |
| 13381 |
| 14981 |
| 9205 |
| 2591 |
| 3574 |
| 2839 |
| 1944 |
| 3737 |
| 1738 |
| 12197 |
| 9210 |
| 1815 |
|
|
(24 total) |
| | matched peaks |
| | contaminants |
|