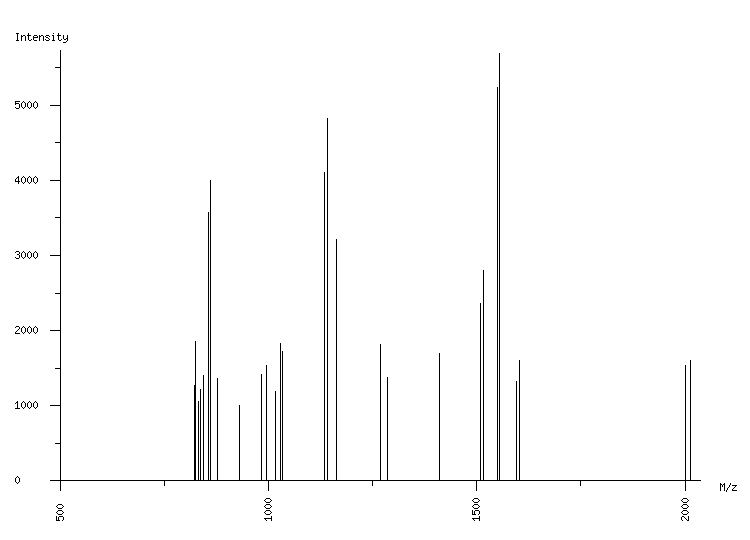
ORGANISM: Homo sapiens
GEL: Human AGS cells; cellular proteins; phosphoproteome
SPOT_ID: 192

|
| M/z |
| 822.29 |
| 824.29 |
| 831.35 |
| 836.28 |
| 838.27 |
| 845.28 |
| 855.47 |
| 861.49 |
| 877.52 |
| 930.32 |
| 983.56 |
| 995.60 |
| 1016.52 |
| 1028.57 |
| 1033.55 |
| 1135.65 |
| 1141.66 |
| 1163.48 |
| 1268.62 |
| 1286.67 |
| 1410.73 |
| 1509.74 |
| 1515.75 |
| 1548.84 |
| 1554.86 |
| 1595.71 |
| 1601.73 |
| 2001.04 |
| 2013.08 |
|
| Intensity |
| 1265 |
| 1856 |
| 1051 |
| 1060 |
| 1223 |
| 1405 |
| 3567 |
| 4003 |
| 1363 |
| 1008 |
| 1422 |
| 1531 |
| 1192 |
| 1834 |
| 1718 |
| 4096 |
| 4827 |
| 3214 |
| 1821 |
| 1375 |
| 1694 |
| 2363 |
| 2803 |
| 5227 |
| 5679 |
| 1321 |
| 1600 |
| 1537 |
| 1604 |
|
|
(29 total) |
| | matched peaks |
| | contaminants |
|