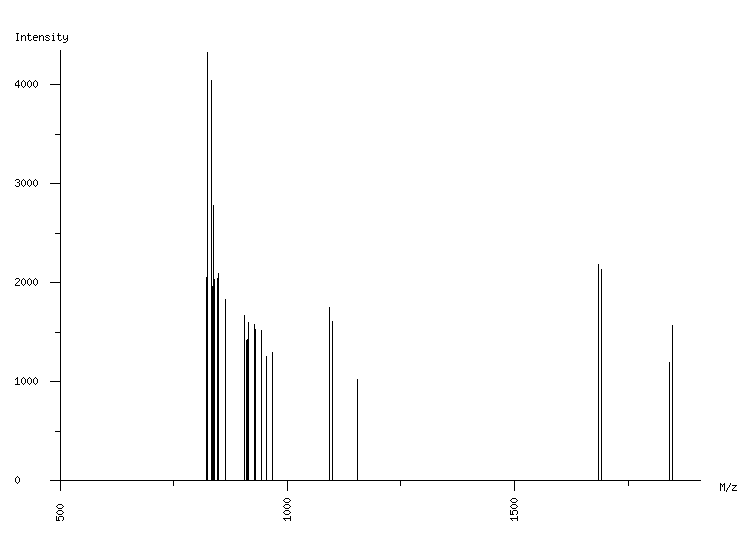
ORGANISM: Homo sapiens
GEL: Human AGS cells; cellular proteins; phosphoproteome
SPOT_ID: 180

|
| M/z |
| 822.29 |
| 824.30 |
| 833.37 |
| 834.34 |
| 836.29 |
| 837.29 |
| 838.30 |
| 839.38 |
| 847.32 |
| 849.32 |
| 864.31 |
| 905.30 |
| 909.29 |
| 912.32 |
| 914.33 |
| 928.32 |
| 930.33 |
| 944.33 |
| 953.35 |
| 967.35 |
| 1092.58 |
| 1098.60 |
| 1155.31 |
| 1684.77 |
| 1690.78 |
| 1841.88 |
| 1847.90 |
|
| Intensity |
| 2052 |
| 4330 |
| 4042 |
| 1831 |
| 1964 |
| 1891 |
| 2787 |
| 2031 |
| 2047 |
| 2094 |
| 1836 |
| 1666 |
| 1421 |
| 1427 |
| 1601 |
| 1582 |
| 1535 |
| 1517 |
| 1262 |
| 1293 |
| 1750 |
| 1606 |
| 1030 |
| 2188 |
| 2131 |
| 1200 |
| 1570 |
|
|
(27 total) |
| | matched peaks |
| | contaminants |
|