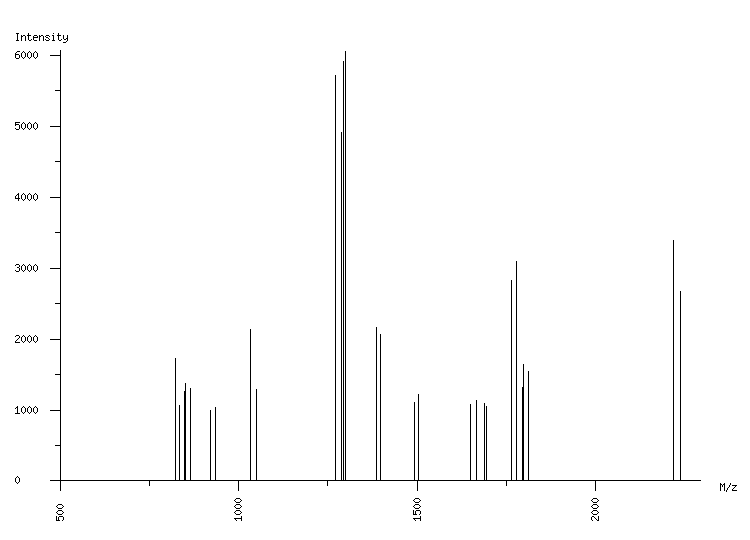
ORGANISM: Homo sapiens
GEL: Human AGS cells; cellular proteins; phosphoproteome
SPOT_ID: 173

|
| M/z |
| 823.09 |
| 834.49 |
| 848.52 |
| 850.52 |
| 864.54 |
| 922.48 |
| 934.52 |
| 1034.11 |
| 1050.08 |
| 1270.72 |
| 1288.78 |
| 1294.70 |
| 1300.72 |
| 1385.72 |
| 1397.76 |
| 1492.71 |
| 1504.75 |
| 1648.81 |
| 1666.87 |
| 1688.88 |
| 1694.90 |
| 1764.93 |
| 1776.96 |
| 1778.97 |
| 1793.91 |
| 1797.04 |
| 1811.96 |
| 2218.28 |
| 2236.35 |
|
| Intensity |
| 1722 |
| 1060 |
| 1255 |
| 1368 |
| 1300 |
| 1000 |
| 1036 |
| 2132 |
| 1289 |
| 5713 |
| 4915 |
| 5914 |
| 6054 |
| 2160 |
| 2069 |
| 1104 |
| 1223 |
| 1074 |
| 1129 |
| 1095 |
| 1053 |
| 2820 |
| 3092 |
| 1991 |
| 1321 |
| 1649 |
| 1549 |
| 3385 |
| 2675 |
|
|
(29 total) |
| | matched peaks |
| | contaminants |
|