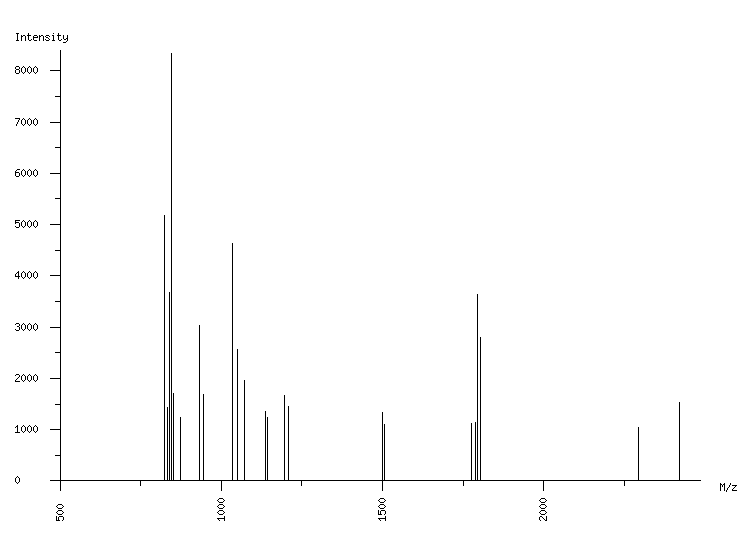
ORGANISM: Homo sapiens
GEL: Human AGS cells; cellular proteins; phosphoproteome
SPOT_ID: 170

|
| M/z |
| 823.11 |
| 825.12 |
| 833.36 |
| 839.08 |
| 839.42 |
| 845.09 |
| 850.53 |
| 872.55 |
| 932.53 |
| 944.56 |
| 1034.14 |
| 1036.14 |
| 1050.11 |
| 1070.56 |
| 1138.58 |
| 1144.61 |
| 1196.56 |
| 1208.61 |
| 1498.82 |
| 1506.73 |
| 1774.98 |
| 1787.02 |
| 1792.99 |
| 1805.03 |
| 2292.16 |
| 2420.23 |
|
| Intensity |
| 5170 |
| 1450 |
| 1434 |
| 3682 |
| 3313 |
| 8345 |
| 1705 |
| 1240 |
| 3031 |
| 1687 |
| 4635 |
| 1140 |
| 2572 |
| 1956 |
| 1353 |
| 1230 |
| 1673 |
| 1459 |
| 1327 |
| 1107 |
| 1115 |
| 1140 |
| 3645 |
| 2796 |
| 1038 |
| 1527 |
|
|
(26 total) |
| | matched peaks |
| | contaminants |
|