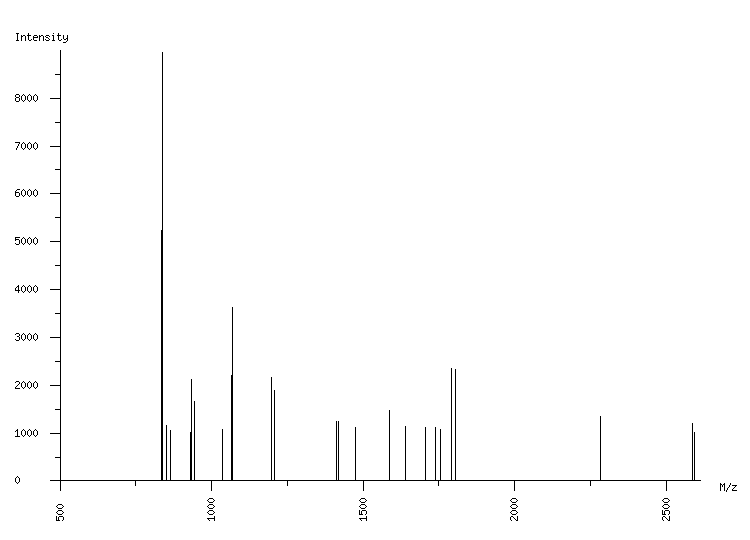
ORGANISM: Homo sapiens
GEL: Human AGS cells; cellular proteins; phosphoproteome
SPOT_ID: 169

|
| M/z |
| 833.38 |
| 838.44 |
| 839.42 |
| 850.53 |
| 864.56 |
| 931.51 |
| 932.53 |
| 943.56 |
| 944.57 |
| 1036.61 |
| 1064.55 |
| 1070.57 |
| 1196.56 |
| 1208.60 |
| 1413.66 |
| 1419.68 |
| 1475.76 |
| 1586.80 |
| 1638.86 |
| 1707.77 |
| 1738.94 |
| 1757.01 |
| 1793.00 |
| 1805.03 |
| 2284.17 |
| 2588.20 |
| 2594.21 |
|
| Intensity |
| 5231 |
| 1126 |
| 8947 |
| 1159 |
| 1065 |
| 1017 |
| 2129 |
| 1651 |
| 1381 |
| 1068 |
| 2213 |
| 3617 |
| 2173 |
| 1897 |
| 1239 |
| 1253 |
| 1108 |
| 1470 |
| 1143 |
| 1125 |
| 1127 |
| 1086 |
| 2355 |
| 2322 |
| 1345 |
| 1200 |
| 1006 |
|
|
(27 total) |
| | matched peaks |
| | contaminants |
|