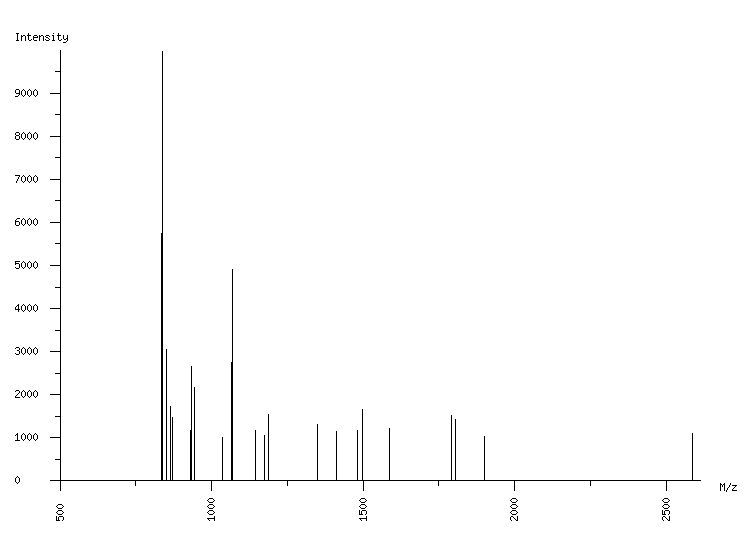
ORGANISM: Homo sapiens
GEL: Human AGS cells; cellular proteins; phosphoproteome
SPOT_ID: 168

|
| M/z |
| 833.39 |
| 839.41 |
| 850.53 |
| 864.53 |
| 872.54 |
| 931.51 |
| 932.52 |
| 943.54 |
| 944.56 |
| 1036.62 |
| 1064.54 |
| 1070.56 |
| 1144.60 |
| 1175.50 |
| 1187.55 |
| 1349.68 |
| 1413.68 |
| 1480.75 |
| 1498.82 |
| 1586.79 |
| 1793.00 |
| 1805.03 |
| 1901.24 |
| 2588.19 |
|
| Intensity |
| 5747 |
| 9956 |
| 3055 |
| 1729 |
| 1482 |
| 1172 |
| 2647 |
| 2104 |
| 2166 |
| 1015 |
| 2753 |
| 4909 |
| 1164 |
| 1056 |
| 1545 |
| 1302 |
| 1148 |
| 1164 |
| 1660 |
| 1222 |
| 1528 |
| 1436 |
| 1023 |
| 1110 |
|
|
(24 total) |
| | matched peaks |
| | contaminants |
|