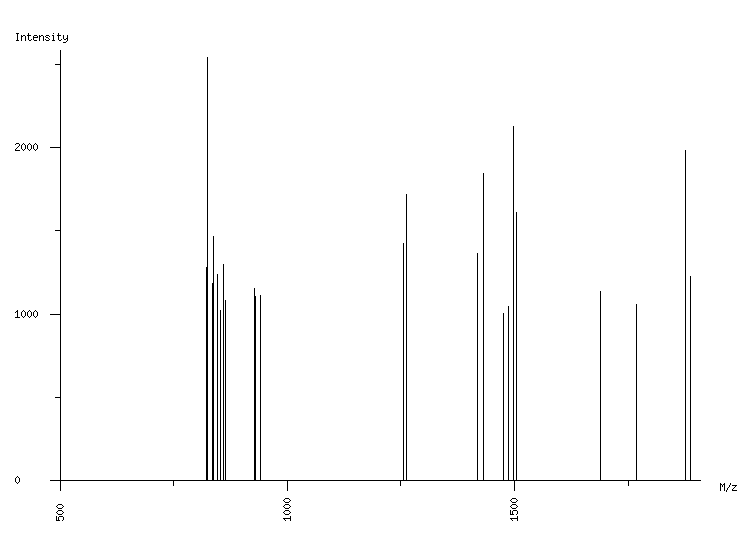
ORGANISM: Homo sapiens
GEL: Human AGS cells; cellular proteins; phosphoproteome
SPOT_ID: 140

|
| M/z |
| 822.28 |
| 824.29 |
| 836.29 |
| 838.30 |
| 846.29 |
| 852.29 |
| 859.35 |
| 863.32 |
| 928.31 |
| 930.31 |
| 940.33 |
| 1255.72 |
| 1261.73 |
| 1418.80 |
| 1430.84 |
| 1475.74 |
| 1487.76 |
| 1498.77 |
| 1504.79 |
| 1689.89 |
| 1767.95 |
| 1875.03 |
| 1887.08 |
|
| Intensity |
| 1282 |
| 2540 |
| 1185 |
| 1468 |
| 1238 |
| 1025 |
| 1299 |
| 1080 |
| 1155 |
| 1105 |
| 1112 |
| 1427 |
| 1720 |
| 1367 |
| 1844 |
| 1004 |
| 1045 |
| 2128 |
| 1608 |
| 1135 |
| 1059 |
| 1984 |
| 1229 |
|
|
(23 total) |
| | matched peaks |
| | contaminants |
|