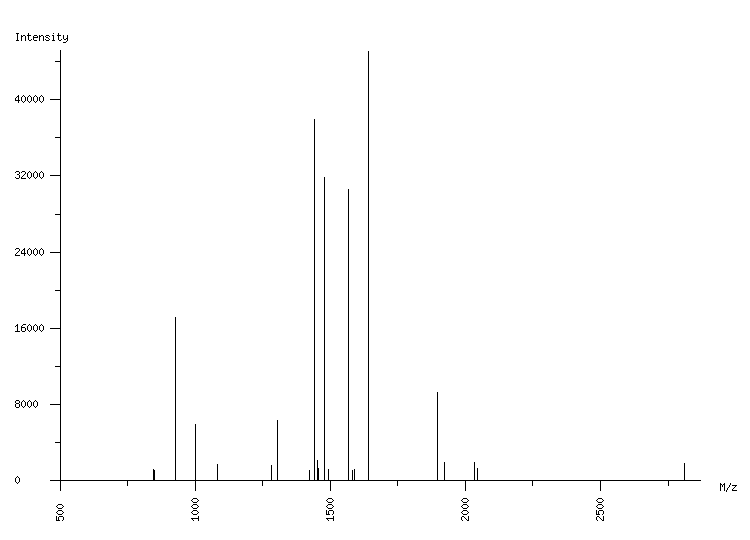
ORGANISM: Homo sapiens
GEL: Human AGS cells; cellular proteins; phosphoproteome
SPOT_ID: 137

|
| M/z |
| 845.08 |
| 850.52 |
| 927.49 |
| 1001.58 |
| 1083.58 |
| 1283.71 |
| 1305.71 |
| 1423.27 |
| 1439.81 |
| 1453.83 |
| 1457.66 |
| 1479.80 |
| 1493.78 |
| 1567.74 |
| 1581.75 |
| 1590.77 |
| 1639.93 |
| 1894.94 |
| 1921.93 |
| 2033.98 |
| 2045.02 |
| 2812.31 |
|
| Intensity |
| 1159 |
| 1153 |
| 17130 |
| 5936 |
| 1680 |
| 1634 |
| 6388 |
| 1057 |
| 37895 |
| 2125 |
| 1264 |
| 31798 |
| 1165 |
| 30573 |
| 1150 |
| 1167 |
| 45083 |
| 9235 |
| 1970 |
| 1966 |
| 1332 |
| 1871 |
|
|
(22 total) |
| | matched peaks |
| | contaminants |
|