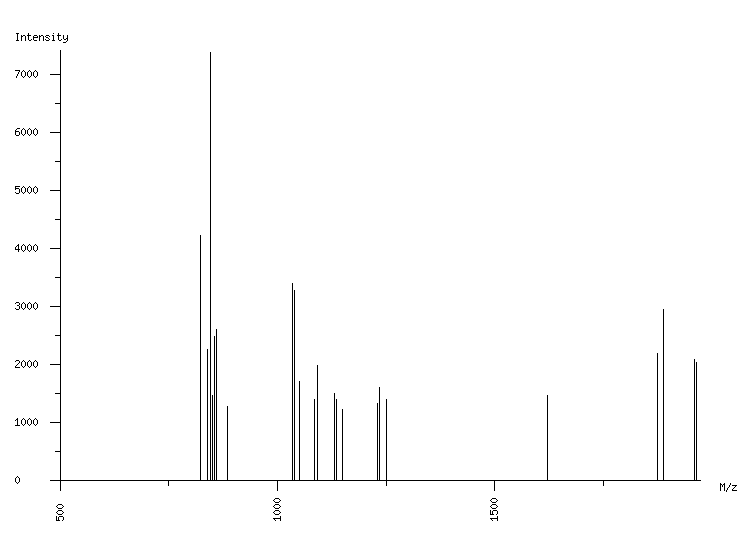
ORGANISM: Homo sapiens
GEL: Human AGS cells; cellular proteins; phosphoproteome
SPOT_ID: 134

|
| M/z |
| 823.11 |
| 839.08 |
| 845.10 |
| 850.53 |
| 854.29 |
| 861.08 |
| 886.24 |
| 1034.14 |
| 1039.59 |
| 1050.11 |
| 1086.44 |
| 1092.46 |
| 1130.60 |
| 1136.62 |
| 1149.67 |
| 1229.60 |
| 1235.63 |
| 1251.65 |
| 1620.84 |
| 1621.86 |
| 1875.03 |
| 1887.07 |
| 1958.99 |
| 1965.00 |
|
| Intensity |
| 4219 |
| 2260 |
| 7368 |
| 1471 |
| 2485 |
| 2614 |
| 1282 |
| 3393 |
| 3268 |
| 1711 |
| 1402 |
| 1988 |
| 1510 |
| 1400 |
| 1226 |
| 1337 |
| 1599 |
| 1394 |
| 1468 |
| 1179 |
| 2195 |
| 2946 |
| 2087 |
| 2041 |
|
|
(24 total) |
| | matched peaks |
| | contaminants |
|