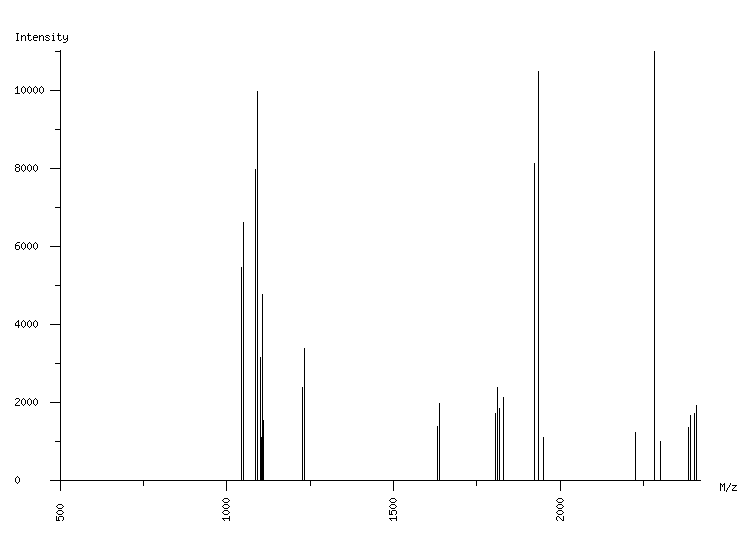
ORGANISM: Homo sapiens
GEL: Human AGS cells; cellular proteins; phosphoproteome
SPOT_ID: 132

|
| M/z |
| 1043.53 |
| 1049.55 |
| 1086.44 |
| 1092.46 |
| 1100.45 |
| 1104.63 |
| 1106.47 |
| 1110.64 |
| 1226.49 |
| 1232.51 |
| 1633.78 |
| 1639.80 |
| 1805.93 |
| 1811.95 |
| 1817.97 |
| 1830.01 |
| 1923.00 |
| 1934.03 |
| 1935.04 |
| 1949.05 |
| 2225.12 |
| 2284.17 |
| 2300.16 |
| 2386.16 |
| 2392.17 |
| 2402.16 |
| 2408.17 |
|
| Intensity |
| 5468 |
| 6618 |
| 7974 |
| 9974 |
| 3160 |
| 1121 |
| 4770 |
| 1541 |
| 2401 |
| 3399 |
| 1392 |
| 1995 |
| 1731 |
| 2385 |
| 1868 |
| 2144 |
| 8137 |
| 1068 |
| 10485 |
| 1125 |
| 1246 |
| 11002 |
| 1004 |
| 1373 |
| 1684 |
| 1722 |
| 1934 |
|
|
(27 total) |
| | matched peaks |
| | contaminants |
|