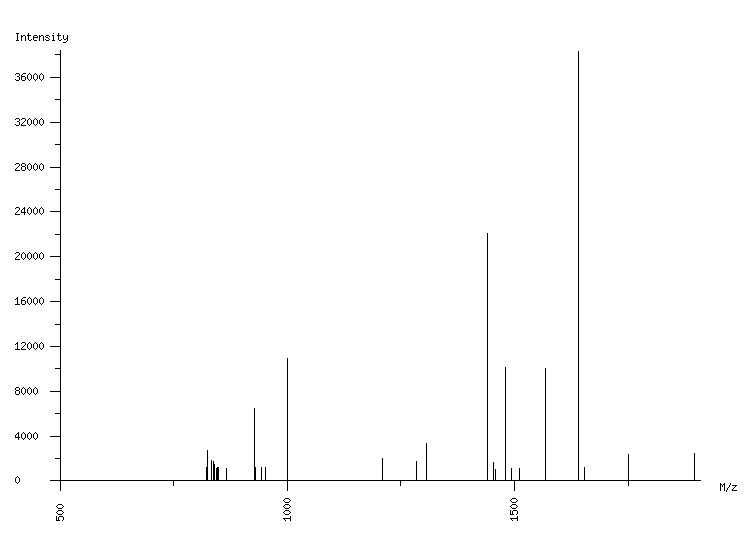
ORGANISM: Homo sapiens
GEL: Human AGS cells; cellular proteins; phosphoproteome
SPOT_ID: 124

|
| M/z |
| 822.28 |
| 824.29 |
| 833.34 |
| 834.32 |
| 837.29 |
| 838.29 |
| 839.38 |
| 845.29 |
| 847.30 |
| 849.30 |
| 865.30 |
| 927.49 |
| 930.30 |
| 944.32 |
| 951.35 |
| 1001.59 |
| 1209.60 |
| 1283.71 |
| 1305.71 |
| 1439.81 |
| 1453.82 |
| 1457.68 |
| 1479.80 |
| 1493.75 |
| 1511.84 |
| 1567.74 |
| 1639.94 |
| 1653.95 |
| 1750.97 |
| 1894.93 |
|
| Intensity |
| 1198 |
| 2763 |
| 1843 |
| 1428 |
| 1322 |
| 1759 |
| 1490 |
| 1142 |
| 1230 |
| 1194 |
| 1152 |
| 6497 |
| 1246 |
| 1240 |
| 1185 |
| 10904 |
| 2046 |
| 1770 |
| 3334 |
| 22079 |
| 1605 |
| 1050 |
| 10089 |
| 1086 |
| 1119 |
| 10049 |
| 38350 |
| 1213 |
| 2321 |
| 2432 |
|
|
(30 total) |
| | matched peaks |
| | contaminants |
|